
 Comparison
Visivo vs Claude Dashboards: Ask Once or Build to Last
Claude Dashboards, now Claude Data, turns chat questions into dashboards. Visivo is BI as code with a semantic layer. Compare review, refresh, and fit.
ComparisonClaude Dashboards, now Claude Data, turns chat questions into dashboards. Visivo is BI as code with a semantic layer. Compare review, refresh, and fit.
 Release Recap
Visivo v2.3.2 cuts visivo dist bundles almost in half, adds a CDN option for hosts that cannot compress, writes smaller parquet, and ships a full PyPI package.
 Comparison
Visivo and Lightdash both keep metrics in code and charge a flat price with unlimited users. Compare $500 vs $3,000 a month, dbt™, joins, review, and AI.
 Comparison
Metabase is click-first BI; Visivo is BI as code. Compare the semantic layer, git review, AI, and per-user vs flat pricing, plus where each one fits better.
 Release Recap
Visivo v2.3.0 opens a sample dashboard in one click, lets the agent check its build and screenshot its work, and applies one set of save rules to every writer.
 Comparison
An honest comparison of Visivo and dbt™ Charts: YAML dashboards, semantic layers, agents and hosting, plus where each tool is the better pick.
 Comparison
Visivo and Evidence are both BI as code. Compare hosted pricing ($500 vs $2,500 a month), the semantic layer, drafts, AI, and which team each one suits.
 Comparison
Visivo and Rill are both code-first BI. Compare the semantic layer, drafts, AI, and per-seat vs flat pricing, plus the seat count where each one wins.
 Release Recap
Visivo v2.2.1 lets agents read your data before they draft, adds layout and filter rules, and makes dashboard tables follow inputs and show dates clearly.
 Release Recap
Visivo v2.2.0 adds an Agent tab and MCP project tools, shared light and dark themes, and HTML template dashboards. Here is what shipped and what to check before upgrading.
 Perspectives
Agentic analytics promises AI that watches your data and investigates on its own. Here is what is real, what is not, and the governed foundation it all depends on.
 Perspectives
Develop locally for speed and privacy, deploy to the cloud for sharing and scale. The winning pattern in 2026 is parity between the two, not a choice between them.
 Release Recap
The first 2.0 patches: nested dashboard layouts, a new visivo init that opens a browser onboarding wizard, in-card scrolling for wide tables, plus Snowflake env-var config and quoted-identifier fixes.
 Release Recap
Visivo 2.0 makes Insights and the semantic layer the single way to build charts. We removed legacy config and Jinja preprocessing, and this post covers what changed and why.
 Release Recap
v1.0.82 completes metric and dimension publishing end-to-end, hardens Parquet writes for null and decimal columns, makes tables fill and scroll their slots, and captures dashboard thumbnails on view.
 Release Recap
v1.0.81 ships the redesigned Explorer (the gamma design) and removes the legacy frontend routes, a cleaner, faster home for analysis.
 Perspectives
The stack has unbundled into storage, transformation, a semantic layer, and presentation. Here is how to assemble it without rebuilding everything yourself.
 Perspectives
Dashboards, operational tools, Slack, and AI agents all need the same metric. A shared metrics layer is what stops each from computing it differently.
 Perspectives
Pivot tables never died, they moved. Here is why drag-and-drop summarization on governed metrics is having a quiet renaissance in the modern data stack.
 Perspectives
Fast feedback loops, real version control, and local previews are why developers reach for code-first BI. DX, not feature checklists, is winning in 2026.
 Release Recap
The biggest release in Visivo's history: metrics, dimensions, and relations arrive as a real semantic layer, the Insights foundation and notebook Explorer land, plus a ClickHouse source and automatic schema introspection.
 Perspectives
Self-serve analytics scales a data team only if guardrails come with it. Here is how code-defined definitions let business users explore without breaking trust.
 Perspectives
Most teams want AI to answer data questions. The blocker is rarely the model; it is the absence of governed definitions the AI can rely on.
 Perspectives
AI answer engines now send real traffic, and they cite structured, authoritative content. Here is how technical teams make their docs and content quotable.
 Perspectives
A SaaS product without analytics now looks unfinished. Here are the six forces reshaping embedded analytics in 2026 and what they mean for code-first teams.
 Perspectives
The modern data stack has consolidated around the warehouse, dbt™, and a semantic layer. Here is what changed in 2026 and where the BI layer is heading.
 Perspectives
GenBI lets people ask questions in plain language and get real charts back. It only works when a governed semantic layer keeps the AI from guessing.
 Perspectives
Headless BI puts governed metrics behind an API so dashboards, embedded apps, AI agents, and Slack all read the same numbers. Here is the pattern and when to use it.
 Perspectives
When every team defines revenue differently, trust erodes. Here is how a code-defined metrics layer creates one definition that every dashboard and tool inherits.
 Perspectives
A clear-eyed look at when code-first BI beats drag-and-drop tools in 2026: governance, testing, reproducibility, and review, and where GUIs still make sense.
 Release Recap
Visivo v1.0.75 bundles the viewer straight into the pip package, so pip install visivo now gives you the complete local app, plus a new --verbose flag for visivo run.
 Development
Treat visualizations as code and get version control, reuse, and automation for your dashboards with Visivo's YAML-based approach.
 Best Practices
Stakeholders trust numbers they have never seen be wrong. How to get there with tests on Insights, one definition per metric, and checks that run before every deploy.
 AI
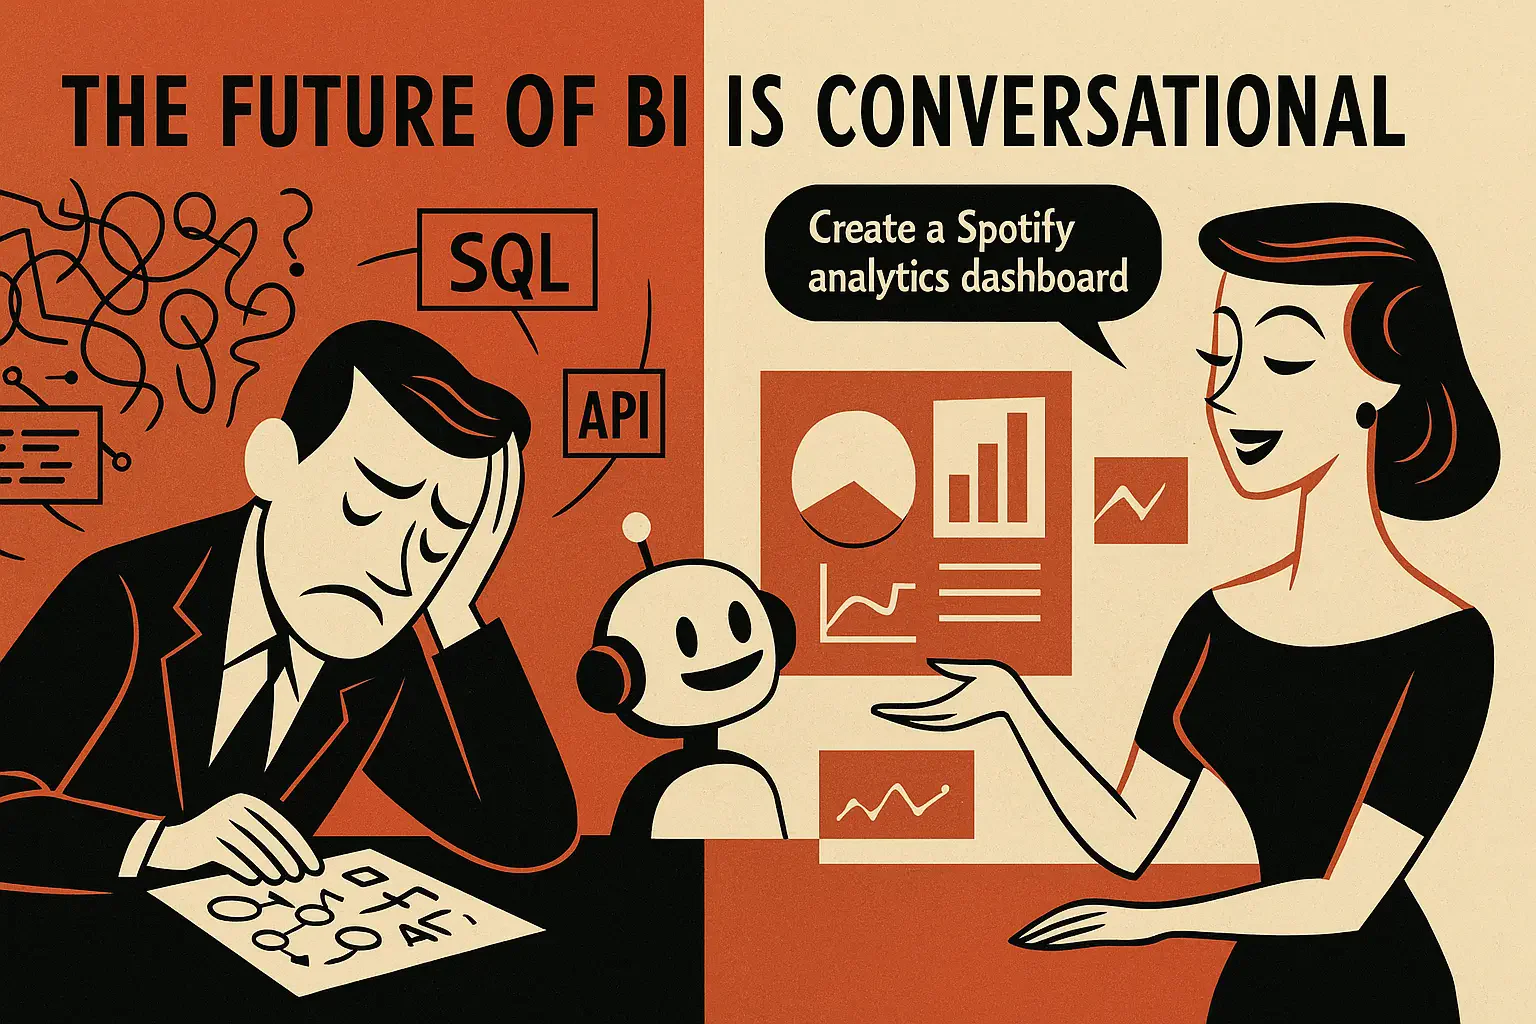
Leveraging AI to build a DLT extract and load of coldplay data from spotify and visualize it in Visivo.
 Testing
Learn comprehensive testing strategies to validate dashboards before deployment, ensuring accurate and trusted analytics for users.
 Tutorial
Power BI's deployment pipelines are configured by hand in a GUI. Visivo's project is YAML in Git, so CI/CD, review and rollback work the way they do for the rest of your code.
 Development
Set up local dbt development to accelerate analytics workflows with instant feedback and isolated testing.
 Governance
Master dashboard lineage tracking to understand data flows, identify issues quickly, and maintain trust in analytics.
 Analytics
Learn how Visivo's BI-as-code philosophy enables teams to build highly customizable analytics dashboards that adapt to any use case through YAML configuration.
 Performance
Learn how to optimize Visivo dashboards for maximum performance using efficient data models, smart visualization choices, and proven configuration patterns.
 DevOps
Learn how to create reproducible BI environments that ensure consistent analytics across development, staging, and production.
 Collaboration
Apply pull request workflows to analytics for better quality control, collaboration, and change tracking using Visivo's YAML-based configurations.
 Partnership
RWX enables parallelized CI/CD with caching and remote debugging, delivering 10x faster test-before-deploy workflows for reliable Visivo dashboards.
 Tutorial
How to add text annotations and shaded regions to a Visivo chart, and when each one earns its place.
 Integration
Learn how to integrate dbt with BI-as-Code for a scalable, maintainable analytics stack that grows with your organization.
 Architecture
Build developer-centric BI dashboards using Visivo's code-first approach, version control, and CI/CD pipelines for scalable analytics.
 Architecture
Explore how BI-as-Code transforms analytics into scalable, automated systems that grow with your organization.
 DevOps
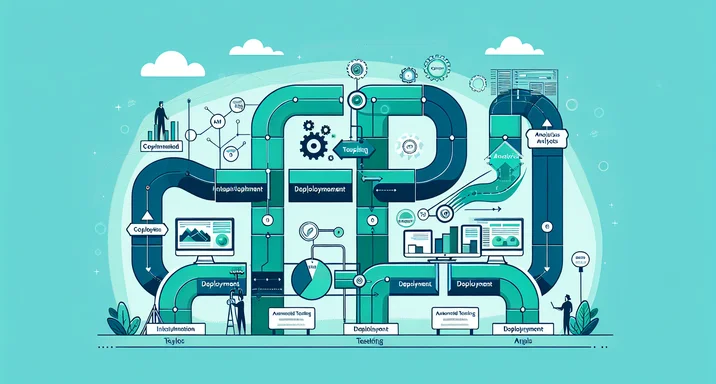
Master CI/CD implementation for analytics projects to achieve reliable data pipelines, faster releases, and immediate error detection.
 Best Practices
Learn how aligning your BI tools with the modern data stack creates reliable, unified data systems and trustworthy analytics.
 Data Engineering
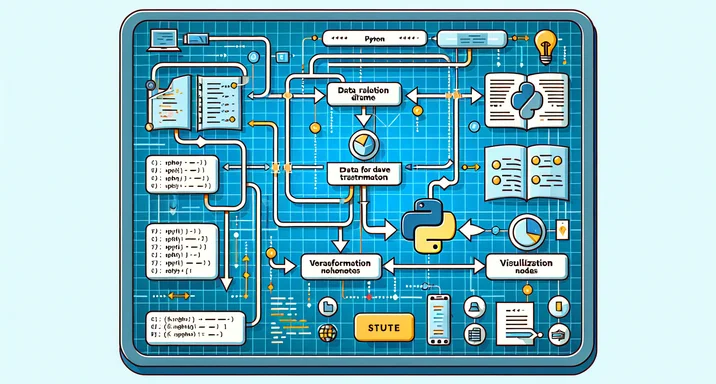
A Python script prints CSV, a Visivo seed loads it, and the dashboard is YAML in Git. How to build, test, ship, and monitor that pipeline.
 DevOps
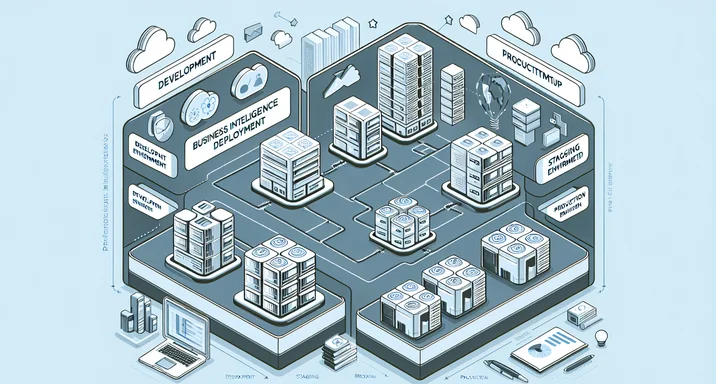
Learn best practices for managing separate staging and production BI environments to ensure quality and prevent disruptions.
 DevOps
Explore how developer-first BI workflows bring automation, control, and predictability to analytics through code-driven practices.
 Integration
Discover how integrating BI tools with dbt workflows creates seamless analytics pipelines with consistent metrics and automated updates.