
CEO & Co-founder of Visivo
Leveraging Claude Code to Build a DLT & Visivo Project
Leveraging AI to build a DLT extract and load of coldplay data from spotify and visualize it in Visivo.
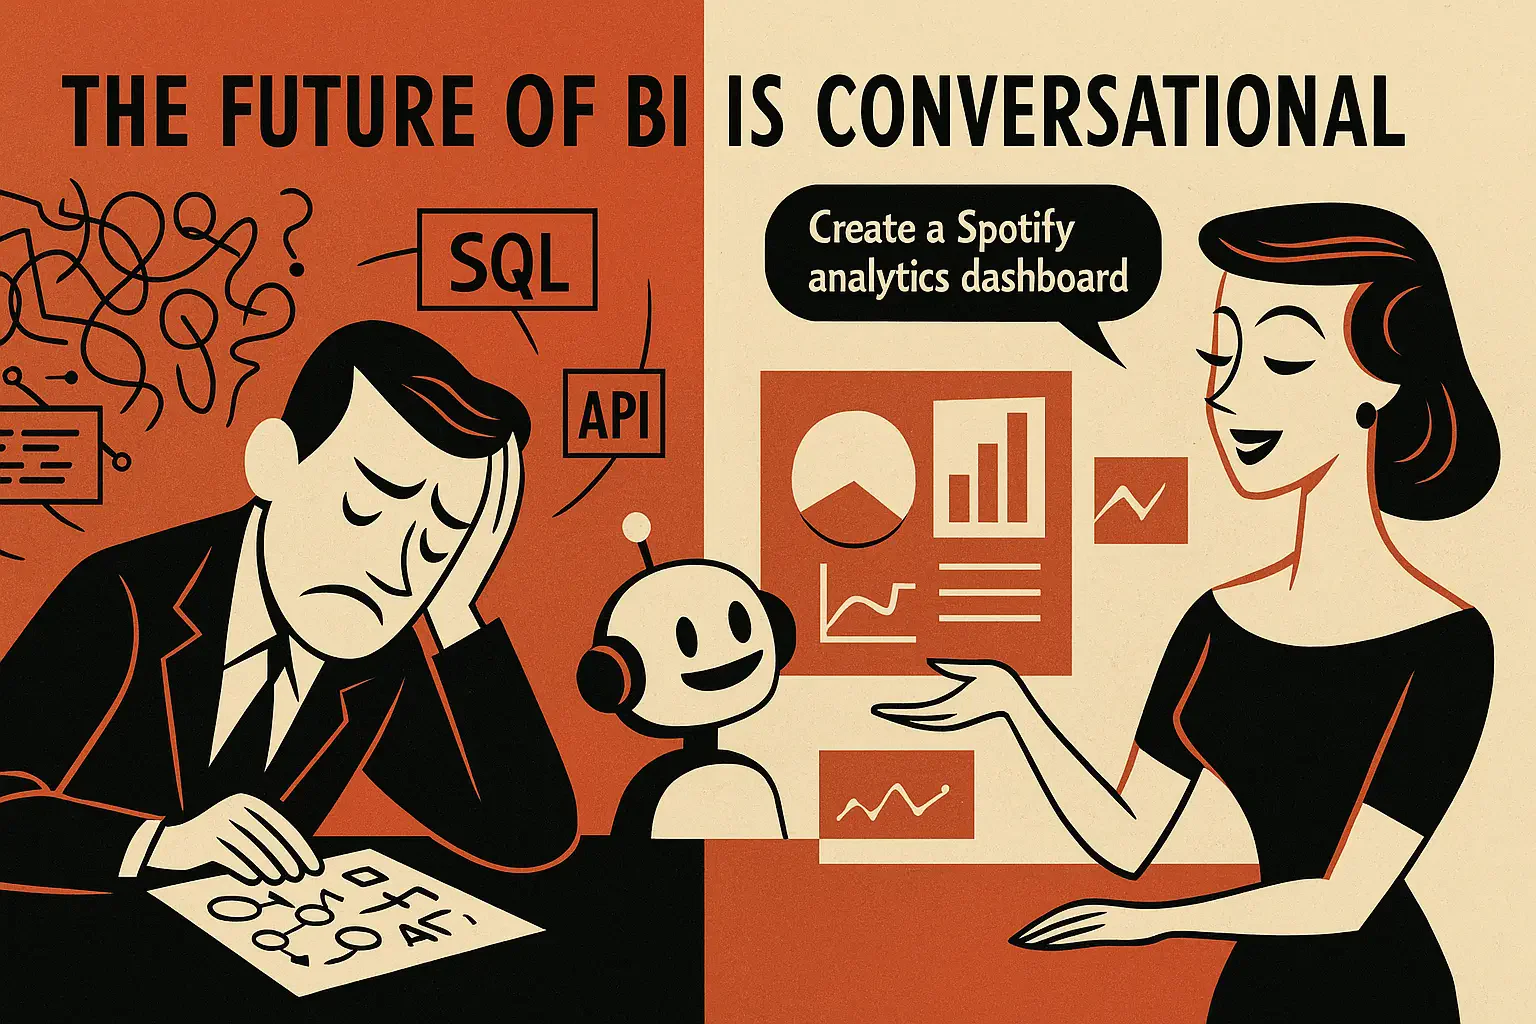
AI-Native Business Intelligence: How I Built a Complete Analytics Stack in Under 15 Minutes with Claude Code
Building a data analytics project used to take weeks. With AI-native BI tools, I built a production-ready Spotify analytics dashboard in a single conversation. Here is how it went.
View the complete project on GitHub
Explore the live dashboard
The idea
You have an idea for a dashboard. The usual path is days of reading API documentation, learning a visualization framework, debugging SQL, and fighting deployment configuration.
Instead, I built the whole thing in one conversation with an AI: extract data from Spotify's API, load it into a warehouse, and build four interactive dashboards on top.
What AI-native business intelligence is
AI-native BI changes who writes the code. You describe what you want in natural language and the AI handles the implementation. It is not only AI analyzing data. It is AI building the whole analytics stack.
I wanted to analyze Coldplay's catalog on Spotify. Here is what I said to Claude Code:
"This repo is currently empty but we're going to create a DLT + Visivo project that extracts data from spotify, stores it in a duckdb database that's checked into this repo and then builds visivo dashboards based on the dataset. I want you to examine the dlt docs - https://dlthub.com/docs/intro docs, and the visivo docs - https://docs.visivo.io/. I already have the spotify client ID. We're going to extract a bunch of information on coldplay and then create some interesting dashboards with it using visivo. Here's the spotify docs https://developer.spotify.com/documentation/web-api"
It got to work:
I'll help you create a DLT + Visivo project for analyzing Coldplay data from Spotify. Let me examine the documentation for both tools and Spotify's API to understand how to best structure this project.

⏺ Fetch(https://dlthub.com/docs/intro)
  ⎿  Received 61.5KB (200 OK)

⏺ Fetch(https://docs.visivo.io/)
  ⎿  Received 156.2KB (200 OK)

⏺ Fetch(https://developer.spotify.com/documentation/web-api)
I used plan mode, so the next step was a plan. It is below.
The stack
Four tools make this work:

Claude Code
AI Development Assistant

DLT
Data Load Tool

DuckDB
Analytics Database

Visivo
Visualization Framework

UV
Package Manager
BI-as-Code Stack
Combine these powerful tools to build complete analytics solutions through natural conversation
- Claude Code: the AI development assistant that orchestrates everything
- DLT (Data Load Tool): a Python library for building data pipelines
- DuckDB: a fast embedded analytics database
- Visivo: a data visualization framework with YAML configuration
I did not need to be an expert in any of them. Claude Code handled the details.
$ curl -fsSL https://visivo.sh | bashFrom idea to dashboard
Step 1: plan in natural language
I described the goal. Claude Code produced a project plan with four phases:
- Project setup with dependency management
- Data extraction pipeline
- Dashboard creation
- Testing and documentation
It also tracked progress against that plan with its built-in task list, so nothing dropped.
Step 2: build the data pipeline
This is where traditional BI development gets slow. You have to:
- Read the API documentation
- Handle authentication
- Write the extraction logic
- Manage rate limits
- Store the data efficiently
With DLT handling rate limits and writes, DuckDB handling storage, and Visivo providing schema-informed, fully code-based BI, Claude Code did all of it. Here is the plan it proposed:
Based on my research, I'm ready to present a comprehensive plan for creating a DLT + Visivo project that analyzes Coldplay data from Spotify.
  ⎿  User rejected Claude's plan:
     ╭─────────────────────────────────────────────────────────────────╮
     │ Plan: Create Coldplay Spotify Analytics with DLT + Visivo       │
     │                                                                 │
     │ Project Structure:                                              │
     │                                                                 │
     │ coldplay-spotify/                                               │
     │ ├── .env                    # Spotify credentials               │
     │ ├── requirements.txt        # Python dependencies               │
     │ ├── extract_spotify_data.py # DLT pipeline for Spotify data     │
     │ ├── coldplay_data.duckdb   # DuckDB database (will be created)  │
     │ ├── visivo_project/        # Visivo dashboard configuration     │
     │ │   ├── project.yml        # Main Visivo config                 │
     │ │   ├── traces/            # Chart trace definitions            │
     │ │   └── dashboards/        # Dashboard layouts                  │
     │ └── README.md              # Project documentation              │
     │                                                                 │
     │ Phase 1: Setup & Dependencies                                   │
     │                                                                 │
     │ 1. Create virtual environment and install dependencies:         │
     │   - dlt[duckdb] for data extraction                             │
     │   - visivo for dashboards                                       │
     │   - requests for API calls                                      │
     │   - python-dotenv for environment variables                     │
     │ 2. Set up .env file with Spotify credentials                    │
     │                                                                 │
     │ Phase 2: DLT Pipeline Implementation                            │
     │                                                                 │
     │ Create extract_spotify_data.py to:                              │
     │ 1. Authenticate with Spotify using Client Credentials flow      │
     │ 2. Extract Coldplay data:                                       │
     │   - Artist profile and statistics                               │
     │   - All albums with release dates and popularity                │
     │   - Top tracks with audio features (danceability, energy, etc.) │
     │   - Related artists for network analysis                        │
     │   - Track audio analysis for deeper insights                    │
     │ 3. Store data in DuckDB tables:                                 │
     │   - artists - Coldplay profile data                             │
     │   - albums - Album metadata                                     │
     │   - tracks - All tracks with features                           │
     │   - audio_features - Detailed audio characteristics             │
     │   - related_artists - Artist relationships                      │
     │                                                                 │
     │ Phase 3: Visivo Dashboard Creation                              │
     │                                                                 │
     │ Build interactive dashboards showing:                           │
     │ 1. Artist Overview Dashboard:                                   │
     │   - Follower count and popularity metrics                       │
     │   - Genre distribution                                          │
     │   - Career timeline                                             │
     │ 2. Album Analysis Dashboard:                                    │
     │   - Album popularity over time                                  │
     │   - Release timeline visualization                              │
     │   - Track count per album                                       │
     │ 3. Musical Evolution Dashboard:                                 │
     │   - Audio features trends (energy, danceability, valence)       │
     │   - Tempo and key distribution                                  │
     │   - Acoustic vs. electronic evolution                           │
     │ 4. Top Tracks Dashboard:                                        │
     │   - Most popular songs with audio features                      │
     │   - Correlation between features and popularity                 │
     │   - Geographic availability                                     │
     │                                                                 │
     │ Phase 4: Implementation Details                                 │
     │                                                                 │
     │ - Use DLT's REST API source for clean Spotify integration       │
     │ - Implement incremental loading for updates                     │
     │ - Create reusable Visivo components                             │
     │ - Add filters for interactive exploration                       │
     │                                                                 │
     │ Would you like me to proceed with implementing this plan?       │
     ╰─────────────────────────────────────────────────────────────────╯

> Let's put all of the visivo files at the top level. Also every visivo yaml file should follow the pattern <name>.visivo.yml including the project file which would be project.visivo.yml Also can you write all of these steps to a TASKS.MD that we can update as we go?

⏺ I'll update the plan to place Visivo files at the top level with the .visivo.yml naming convention and include a TASKS.MD file.
The plan's traces/ folder is the Visivo 1.x layout. In Visivo 2.x, each chart is built from Insights, and the matching folder would be insights/.
It handled things I did not expect it to:
- Researched the Spotify API endpoints
- Implemented OAuth2 authentication
- Built a DLT pipeline that extracted:
- Artist information with 81.7M followers tracked
- 110 albums (including singles and compilations)
- 405 individual tracks with metadata
- Top 10 most popular songs
The pipeline was production-ready in minutes, not days.
Step 3: generate the SQL
I needed queries to analyze:
- Musical evolution over 25+ years
- Album release patterns
- Track duration trends
- Popularity metrics
Instead of writing them, I described what I wanted to see. Claude Code generated queries like this one:
WITH album_stats AS (
  SELECT
    COUNT(DISTINCT album_id) as total_albums,
    COUNT(*) as total_tracks,
    MIN(CAST(substr(album_release_date, 1, 4) AS INTEGER)) as first_year,
    MAX(CAST(substr(album_release_date, 1, 4) AS INTEGER)) as latest_year
  FROM coldplay_data_20250718022923.tracks
)
SELECT
  total_albums,
  total_tracks,
  latest_year - first_year as years_active
FROM album_stats
I did not write a line of it.
Step 4: describe the dashboards
Building a dashboard normally means learning a charting library, writing configuration, debugging layout, and wiring up data bindings. Here, I described the visualization:
"Create an artist overview dashboard with follower count, popularity gauge, and genre visualization"
Claude Code built four dashboards:
- Artist Overview: popularity metrics, follower counts, career statistics
- Album Analysis: timeline visualizations, release patterns, album type distribution
- Musical Evolution: track duration trends, release strategy changes over time
- Top Tracks: popularity rankings, duration analysis, interactive bubble charts
Each one had several interactive visualizations, consistent styling, and a responsive layout.
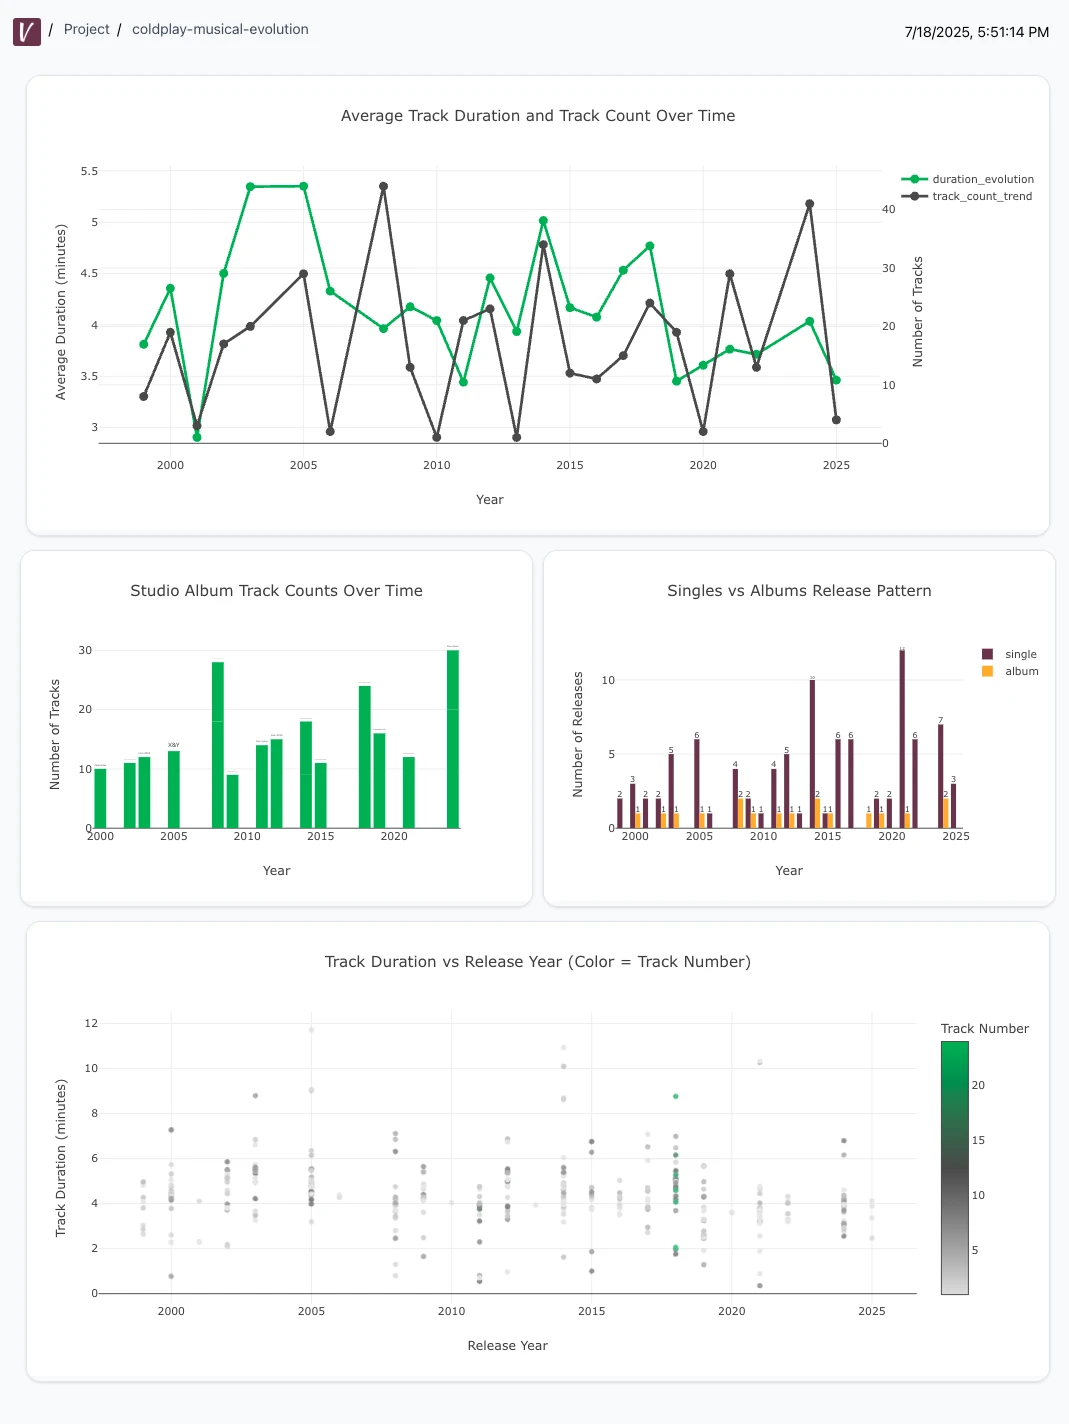 The Musical Evolution dashboard showing track duration trends, album release patterns, and track distribution over Coldplay's 25+ year career
When the API changed under us
The real test came at the first roadblock. Spotify had restricted certain API endpoints (audio features) for new applications.
In traditional development that means:
- Discovering the issue through failed API calls
- Reading the documentation to understand the limitation
- Redesigning the solution
- Rewriting a significant amount of code
With Claude Code the pivot was quick. It:
- Detected the API restrictions
- Adjusted the data pipeline
- Redesigned the visualizations around the available data
- Proposed alternative metrics that were as useful
Not every metric or chart it produced was right. But it was a solid starting point, and iterating on it is cheap. More on that below.
What I did not have to do
- Read any API documentation
- Learn DLT's pipeline syntax
- Study Visivo's YAML schema
- Write SQL joins by hand
- Debug authentication flows
- Handle pagination or rate limits
- Fix YAML indentation errors
- Research visualization best practices
All of it happened in conversation. When an error came up (validation issues in the dashboard configuration, for example), I pasted the error message and Claude Code fixed it.
What was built
In under an hour:
- 4 production-ready dashboards
- 15+ interactive visualizations, including:
- Time series analysis
- Distribution charts
- Ranking tables
- Bubble plots
- Gauge metrics
- 500+ data points analyzed
- Complete documentation
- Deployment-ready configuration
This is not a prototype. It is a working BI project that could be deployed to production as is.
See it yourself
The code and dashboards are on GitHub:
GitHub Repository: visivo-io/coldplay-spotify
Live Dashboard: Musical Evolution
The repository includes:
- The complete DLT pipeline for Spotify data extraction
- All four Visivo dashboards with their configuration
- Sample data and visualizations
- Step-by-step instructions to run it yourself
Note: this project was built with Visivo 1.x, before Insights and the semantic layer replaced traces in Visivo 2.0. To run it as it is, install visivo<2. On Visivo 2.x, rebuild the charts as Insights.
Fork it, change the artist, and you have your own analytics dashboard.
What AI-native BI changes
1. Anyone who can describe a dashboard can build one
You do not need to be a data engineer or a BI developer.
2. 10x faster development
What took weeks takes hours.
3. Errors get fixed, not just reported
When something breaks, and something always does, the AI reads the error and repairs it.
4. Best practices by default
The code is clean, the queries are reasonable, and the visualizations follow sensible design rules without anyone asking.
5. The conversation is the documentation
Every decision and implementation detail is in the transcript.
Getting started
Prerequisites
- Python 3.12+
- Claude Code access
- A data source (API, database, or files)
Your first AI-native BI project
- Start with a clear goal: "I want to analyze [your data] and visualize [your metrics]"
- Let Claude Code plan: share the idea and let it draft the plan
- Iterate in conversation: describe what you want to see and check the result
- Refine as you go: if something is wrong, say so
Tips
- Be specific about your data. Share sample data or API documentation if you have it. Often the AI can
curlthe data itself, so try that before you pull it by hand. - Describe visualizations conceptually. "Show trends over time" rather than "create a line chart". Be prescriptive only when you need something specific.
- Let it make mistakes. It will fix them. If you over-specify, you may miss ideas you would not have had on your own.
- Iterate freely. A change that would take hours takes seconds, which matters most when you are tuning a dashboard.
BI is becoming conversational
Traditional BI tools tried to make analytics self-service through drag-and-drop. AI-native BI gets there through natural language. You do not learn a tool. You ask the question.
That makes governance more important, not less. The better structured your data and your semantic layer, the better the AI's output. That is where Visivo helps: the models, metrics and dimensions you declare are the structure the AI reasons over.
Why this matters for your team
For business leaders
- Faster answers: from question to answer in hours, not weeks
- Lower cost: less dependence on specialized BI developers
- Better adoption: teams build their own dashboards without training
For developers
- Focus on the analysis, not the implementation
- Learn faster by watching best practices applied
- Test ideas without committing to them
For data teams
- Support more projects with the same people
- Consistent quality across every build
- Try new approaches without the overhead
Your turn
The Coldplay dashboard was a test. Apply the same approach to your own data: a sales dashboard in an afternoon, customer analytics during a meeting, a financial report from a plain-English description.
- Pick a dataset you want to analyze
- Open Claude Code
- Describe what you want in plain English
- Iterate until it is right
Share what you build.
Technical addendum: tools used
- Claude Code: AI development assistant
- DLT: Data Load Tool for Python
- DuckDB: embedded analytics database
- Visivo: data visualization framework
- UV: fast Python package manager
Each one works well from a conversational interface, which is why the stack holds together.