AI Native Business Intelligence
Develop locally. Deploy with confidence. Collaborate without conflicts.
BI-as-code. Develop locally with instant feedback. Deploy without breaking production. Enable true collaboration between data and business teammates.
Your BI Problems, Solved
See how Visivo eliminates the pain points that slow down your data team
The Problem
Waiting hours for dashboards to update in production
Every change requires deployment, waiting for CI/CD, and hoping nothing breaks. Developers waste hours on feedback loops.
Impact: 5+ hours wasted per week on deployment cycles
The Solution
Local development with instant hot reload
Work offline with visivo serve. See changes immediately. No cloud delays, no deployment queues.
- Instant feedback with hot reload
- Work offline - no internet required
- Test with real data locally
- Zero deployment time during development
$ visivo serveWhy Visivo is Different
We're not just another BI tool. We're bringing modern software engineering to business intelligence.
Local-First Development
Work offline with instant feedback. No cloud delays, no waiting for deployments. Your laptop is your development environment.
- Instant hot reload
- Work without internet
- Zero latency feedback
Git-Native BI
Version control for dashboards. Code review for metrics. Roll back bad changes. BI finally gets real software engineering practices.
- Version control
- Code review process
- Easy rollbacks
AI-Powered Assistance
LLMs understand your semantic layer. Generate YAML from natural language. Both analysts and engineers can build with AI help.
- Natural language queries
- Smart YAML generation
- Context-aware assistance
Deploy Anywhere
Self-host on your infrastructure or use our cloud. No vendor lock-in. Your data stays where you want it.
- Self-host option
- Cloud available
- No vendor lock-in
Stop fighting your BI tool. Start building with confidence.
$ curl -fsSL https://visivo.sh | bashExtend your Lineage from Transformation to Insight
Sources
Connections to your data systems (databases, files, APIs); define credentials, hosts, and env-based configs.
sources:
  - name: domain_source
    type: postgresql
    database: app_db
    host: "{{ env_var('APP_HOST') }}"
    username: "{{ env_var('APP_DATABASE_USERNAME') }}"
    password: "{{ env_var('APP_DATABASE_PASSWORD') }}"
Static example showing a Postgres source with env var interpolations.
- Combine multiple sources (Postgres, Snowflake, CSV, APIs) in one project.
- Use env vars for host/credentials to switch between dev/staging/prod.
- Supports SQL and script-based connectors for custom data formats.
Version Control
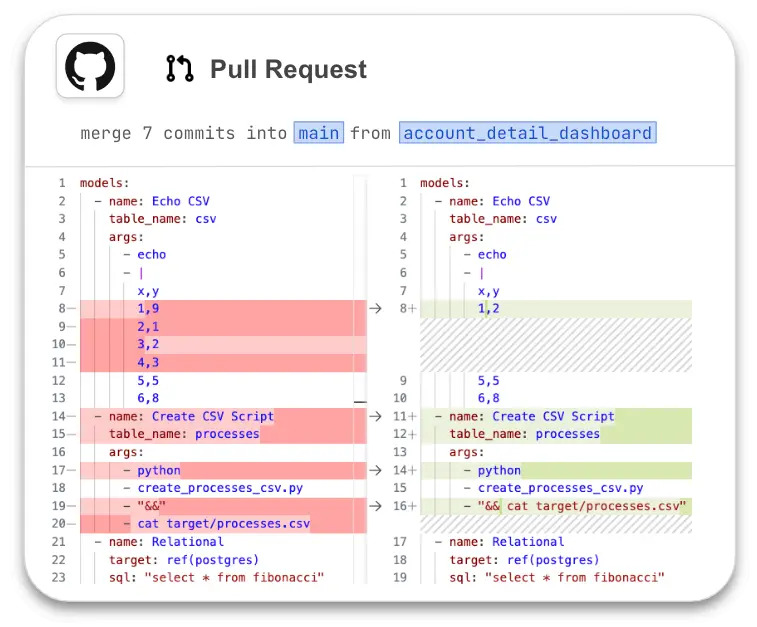
Keep your HEAD clear & commit to git
Collaborate with your team, track changes, and maintain your dashboards with the same tools you use for the rest of your code.


Version Control
Keep your HEAD clear & commit to git
Collaborate with your team, track changes, and maintain your dashboards with the same tools you use for the rest of your code.
CI/CD
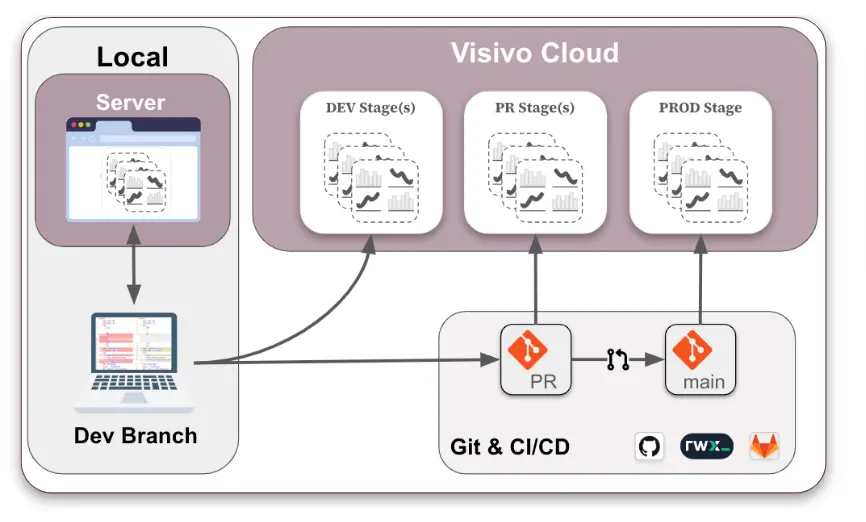
Deployments that mirror your workflow
Super charge your development cycle with seamless local development and a CI/CD pipeline that deploys projects to all of your environments.

CI/CD
Deployments that mirror your workflow
Super charge your development cycle with seamless local development and a CI/CD pipeline that deploys projects to all of your environments.


Testable
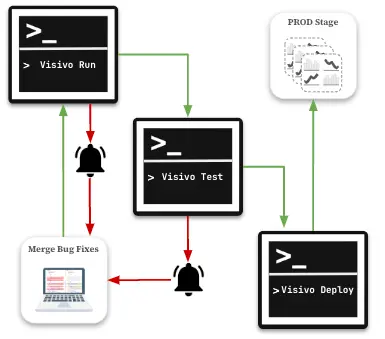
Goodbye broken dashboards
Test new charts, tables and dashboards before they go live in production. Ensure your tests are passing before data refresh. Receive alerts when your dashboards are broken and fix problems before your stakeholders are impacted.


Testable
Goodbye broken dashboards
Test new charts, tables and dashboards before they go live in production. Ensure your tests are passing before data refresh. Receive alerts when your dashboards are broken and fix problems before your stakeholders are impacted.
Dependency Management
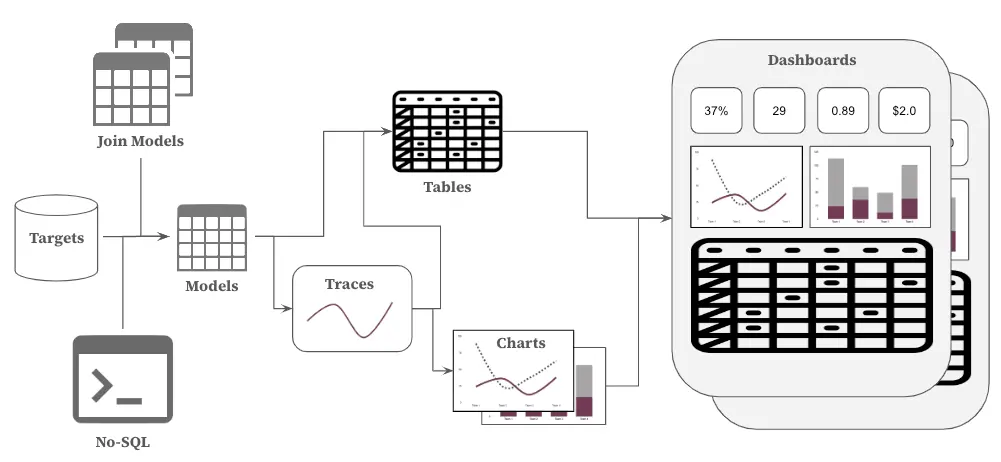
DAG enables robust development
Visivo projects are automatically built with a Directed Acyclic Graph (DAG) that manages relationships between your components. This ensures that your dashboards are always up-to-date, accurate and easy to debug.

Dependency Management
DAG enables robust development
Visivo projects are automatically built with a Directed Acyclic Graph (DAG) that manages relationships between your components. This ensures that your dashboards are always up-to-date, accurate and easy to debug.


DevTools
Build visualizations faster
VScode linter and auto-complete features make writing YAML configurations a breeze.
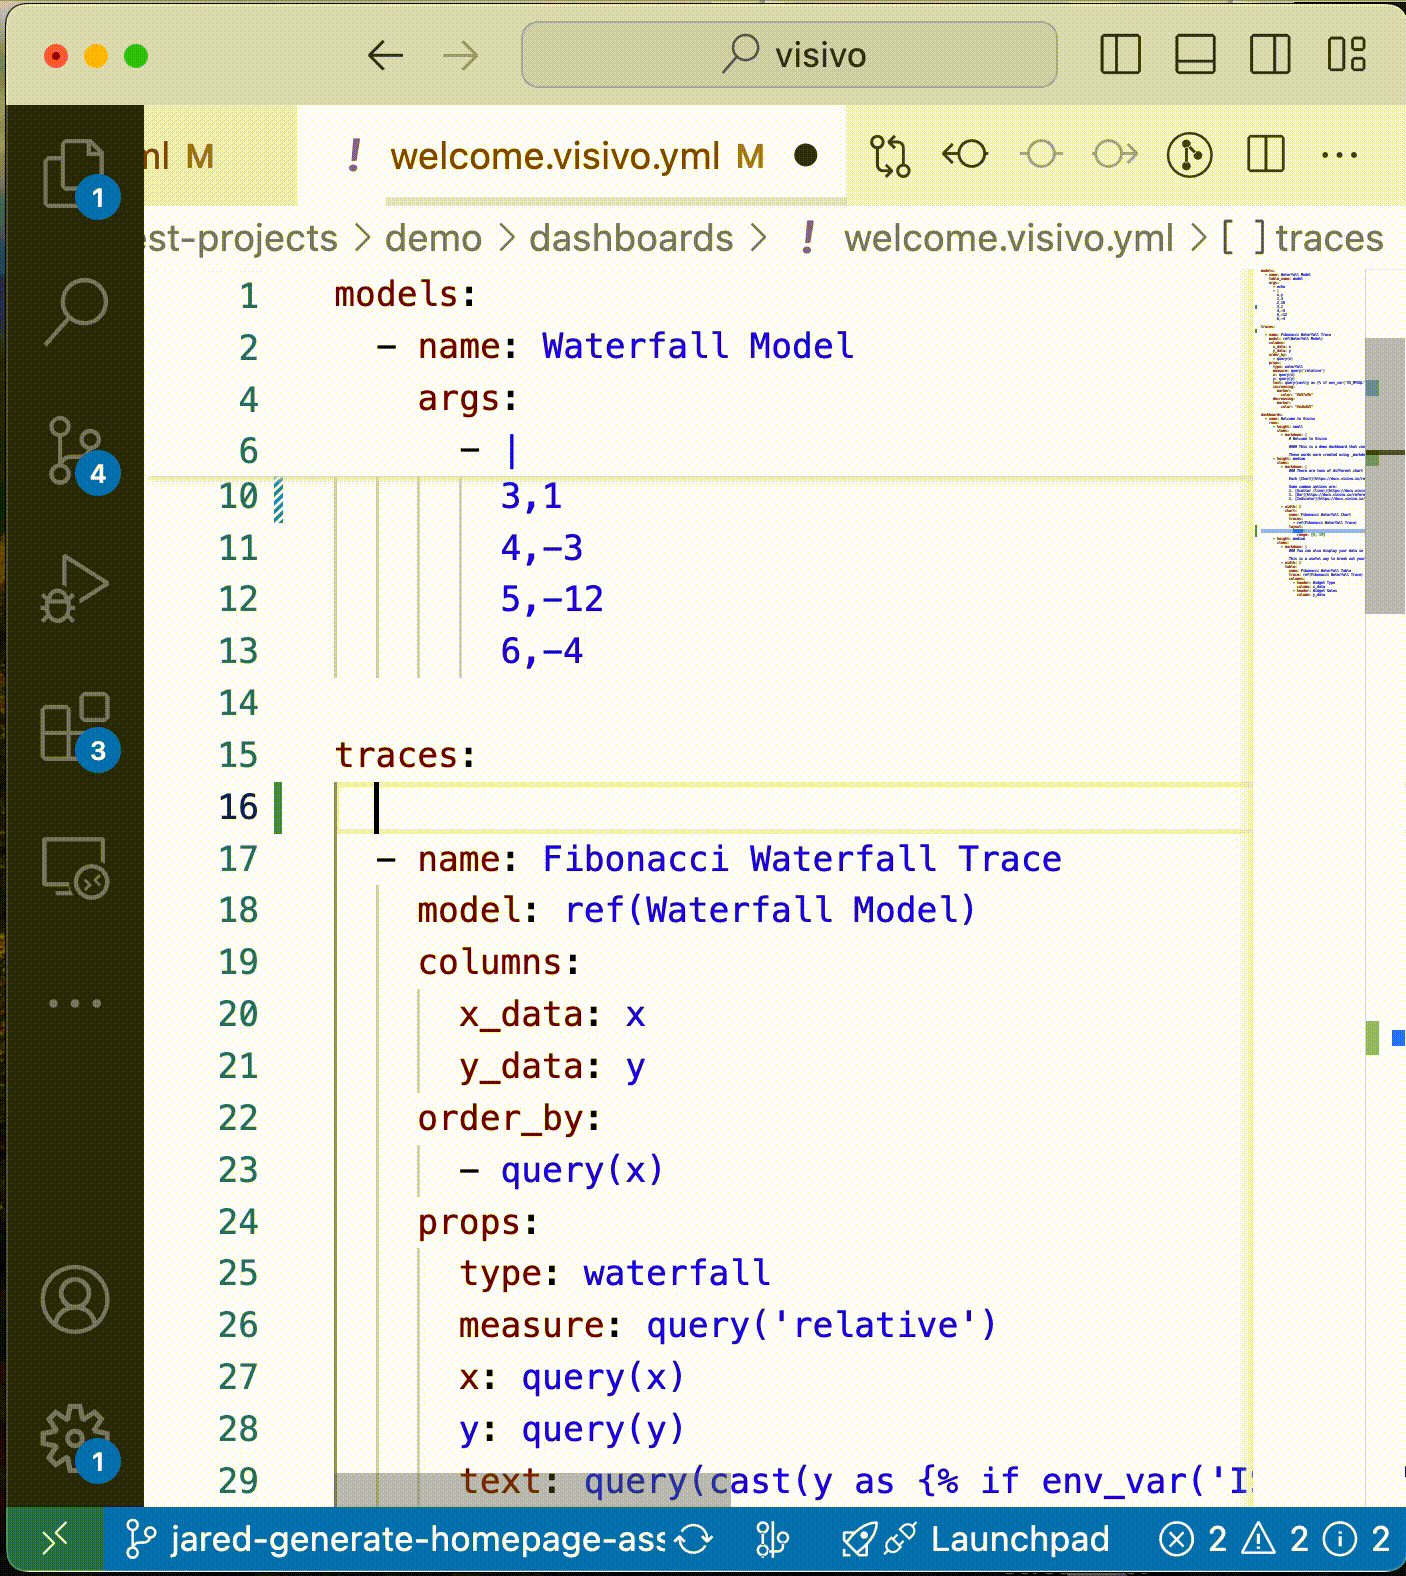


DevTools
Build visualizations faster
VScode linter and auto-complete features make writing YAML configurations a breeze.
Dynamic Rendering
Jinja2 templating for dynamic rendering
Jinja2 templating allows you to dynamically render your dashboards based on environment variables, conditional logic, and loops.
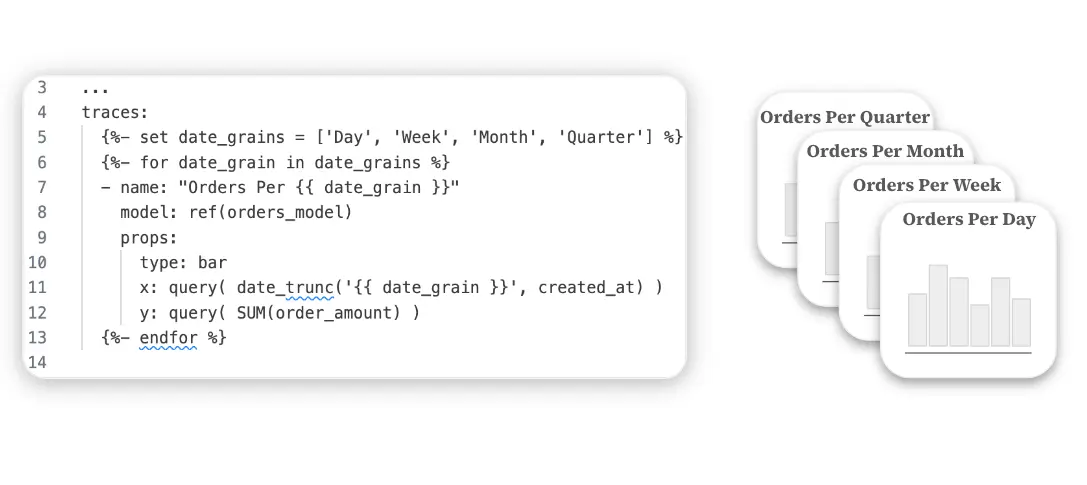

Dynamic Rendering
Jinja2 templating for dynamic rendering
Jinja2 templating allows you to dynamically render your dashboards based on environment variables, conditional logic, and loops.


Unblock Creativity
Layout & configurations options
With over 20+ trace types and thousands of configuration options, you can build the perfect dashboard for your stakeholders.
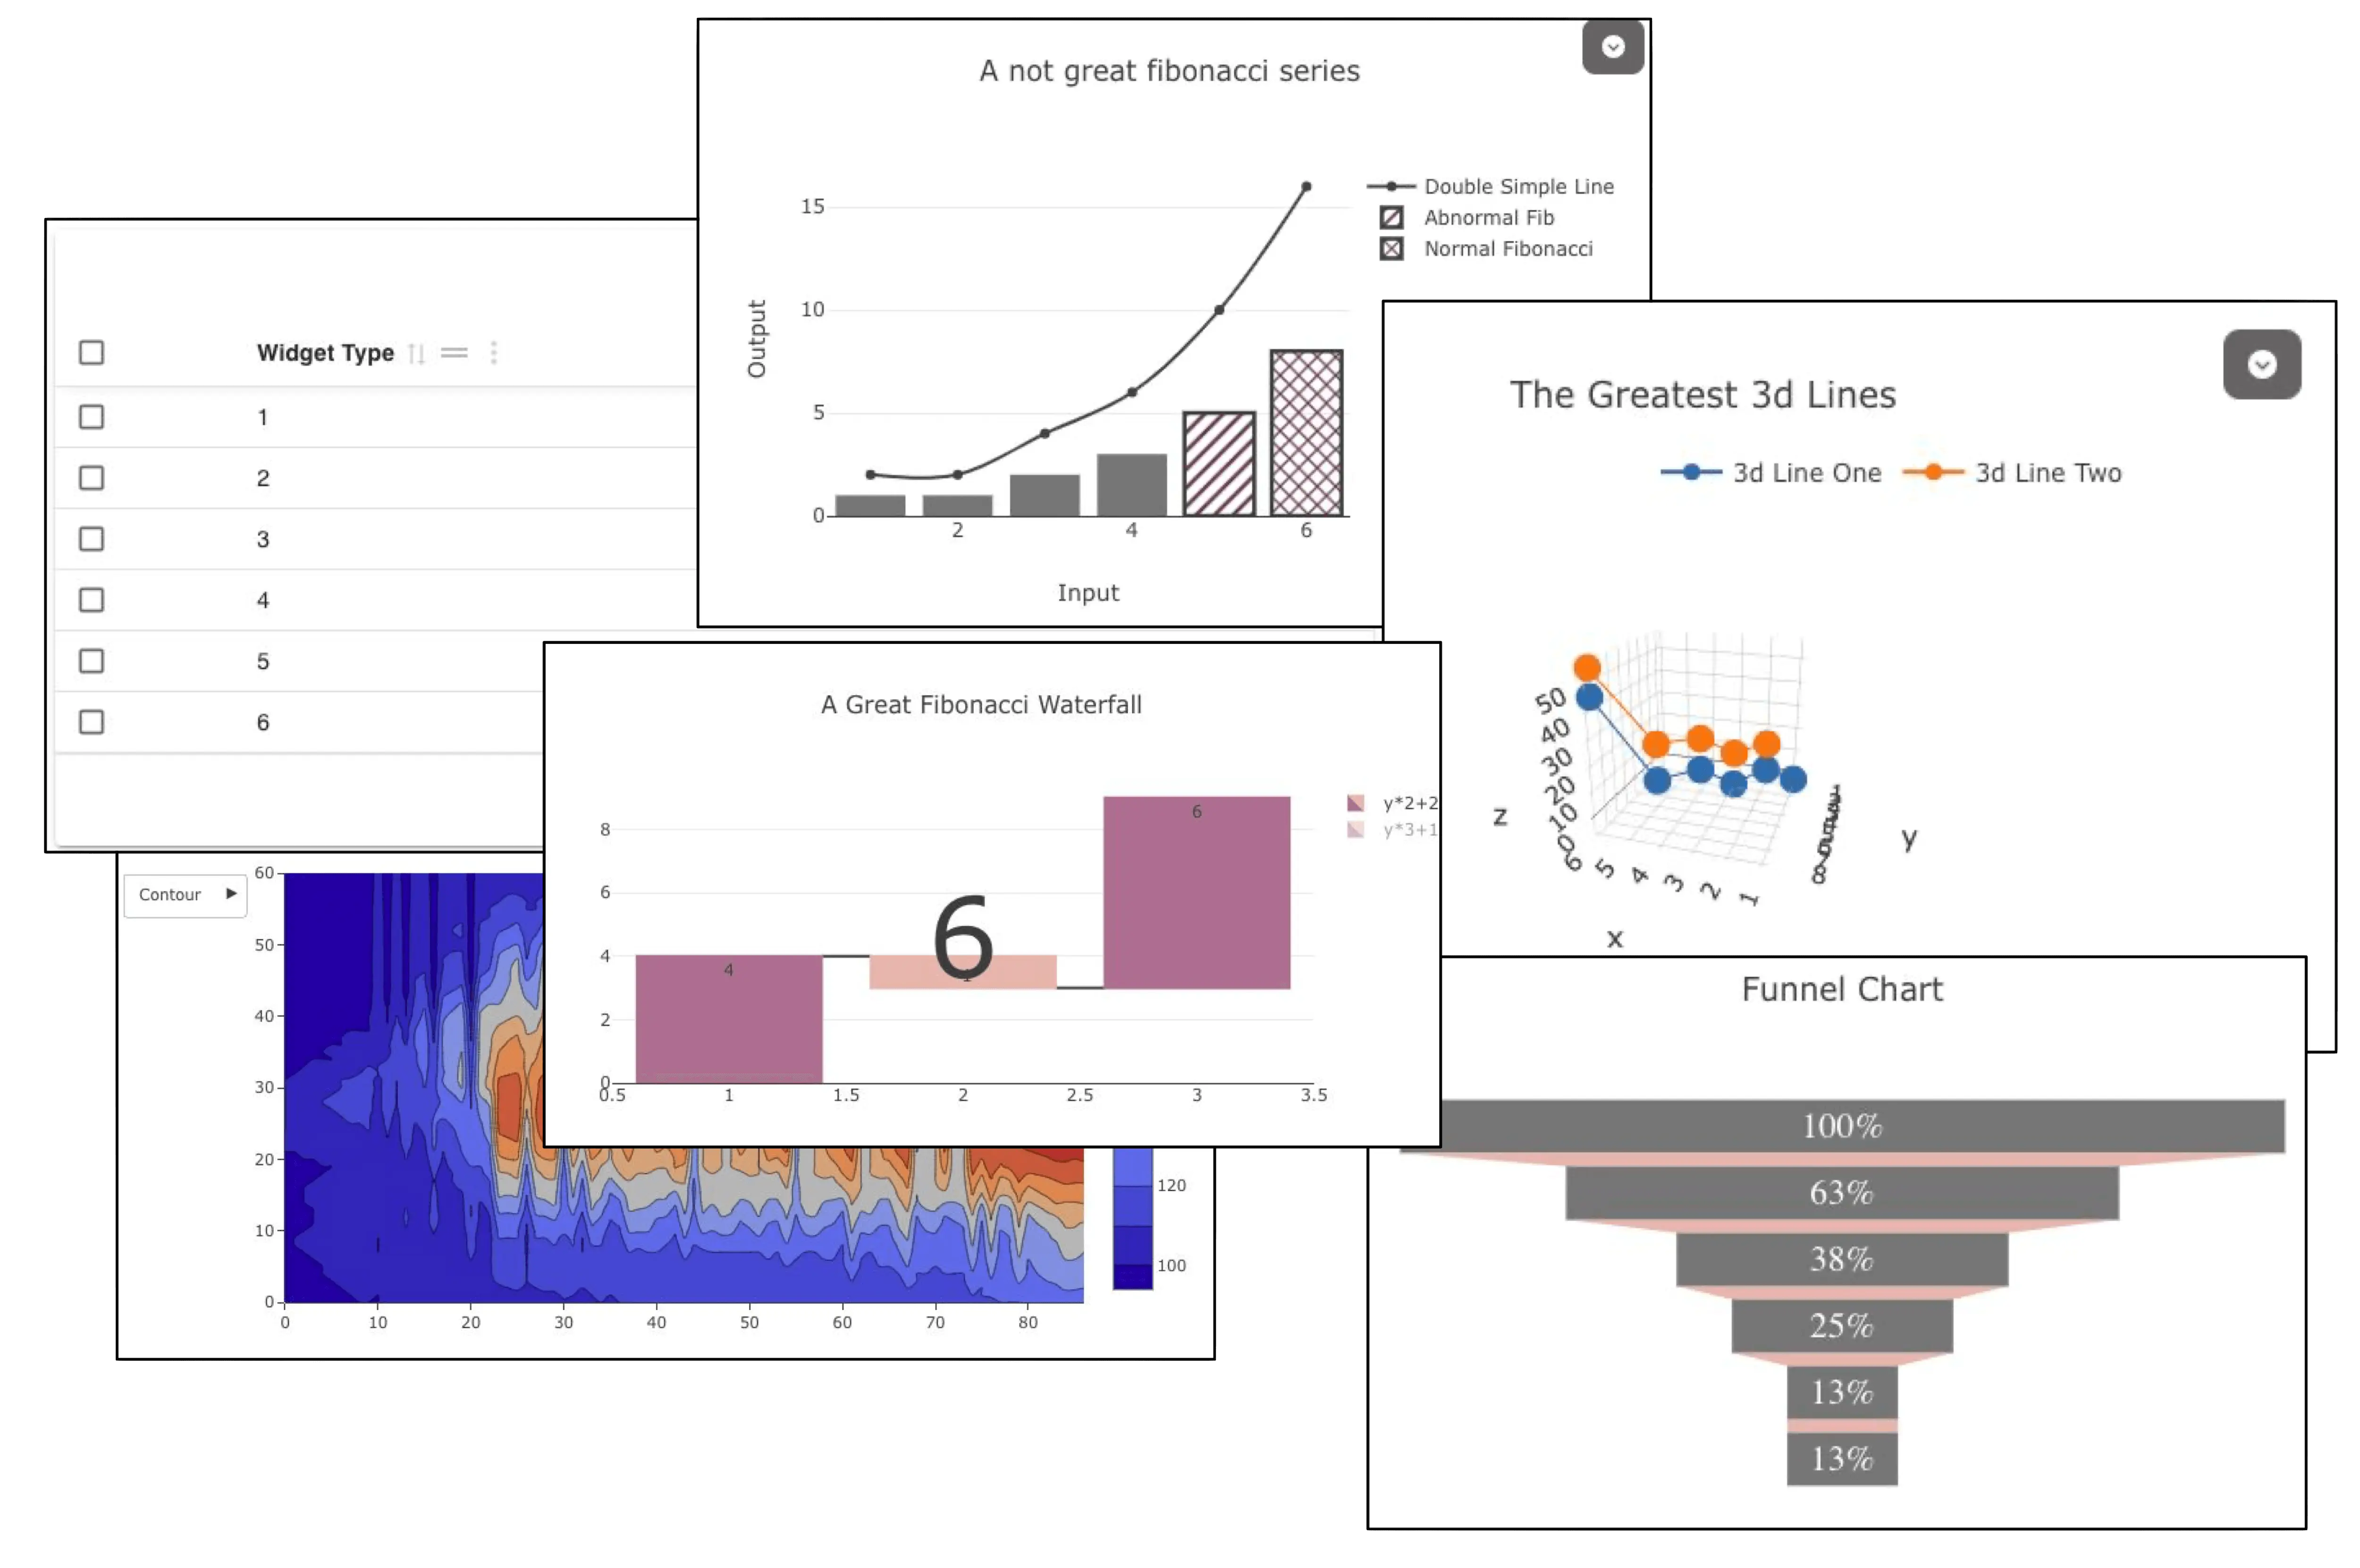


Unblock Creativity
Layout & configurations options
With over 20+ trace types and thousands of configuration options, you can build the perfect dashboard for your stakeholders.
Interactive
Interactivity without slow load times
Unlike traditional BI tools, Visivo does not need to re-fetch data every time a user interacts with your dashboard.
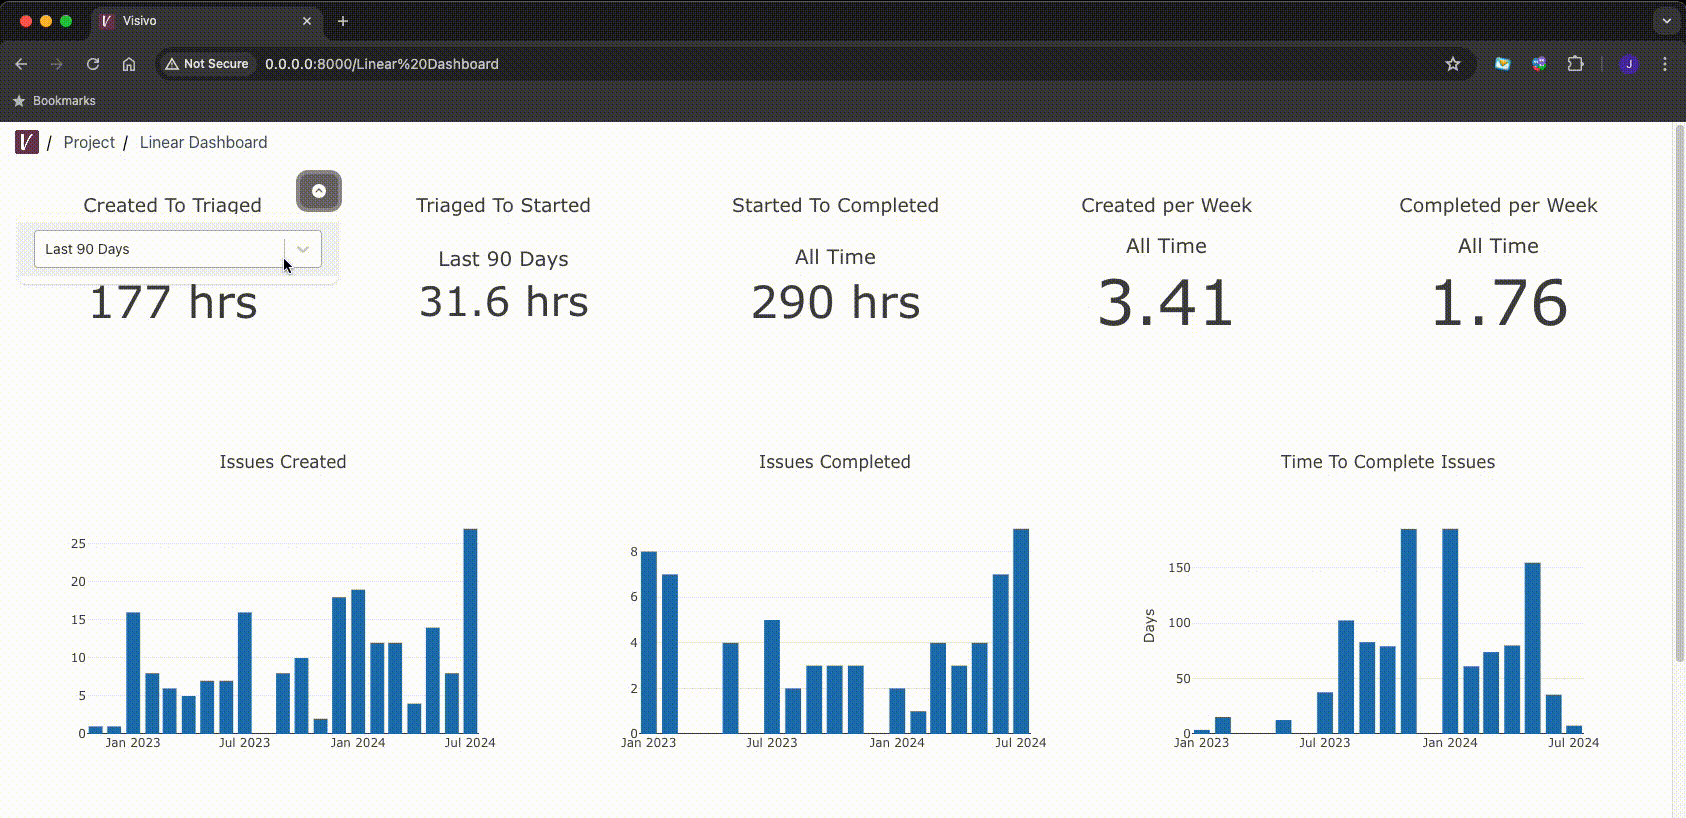

Interactive
Interactivity without slow load times
Unlike traditional BI tools, Visivo does not need to re-fetch data every time a user interacts with your dashboard.


Mobile Optimized
Meet your stakeholders where they are
Deliver your insights to your team on the go and in the office.
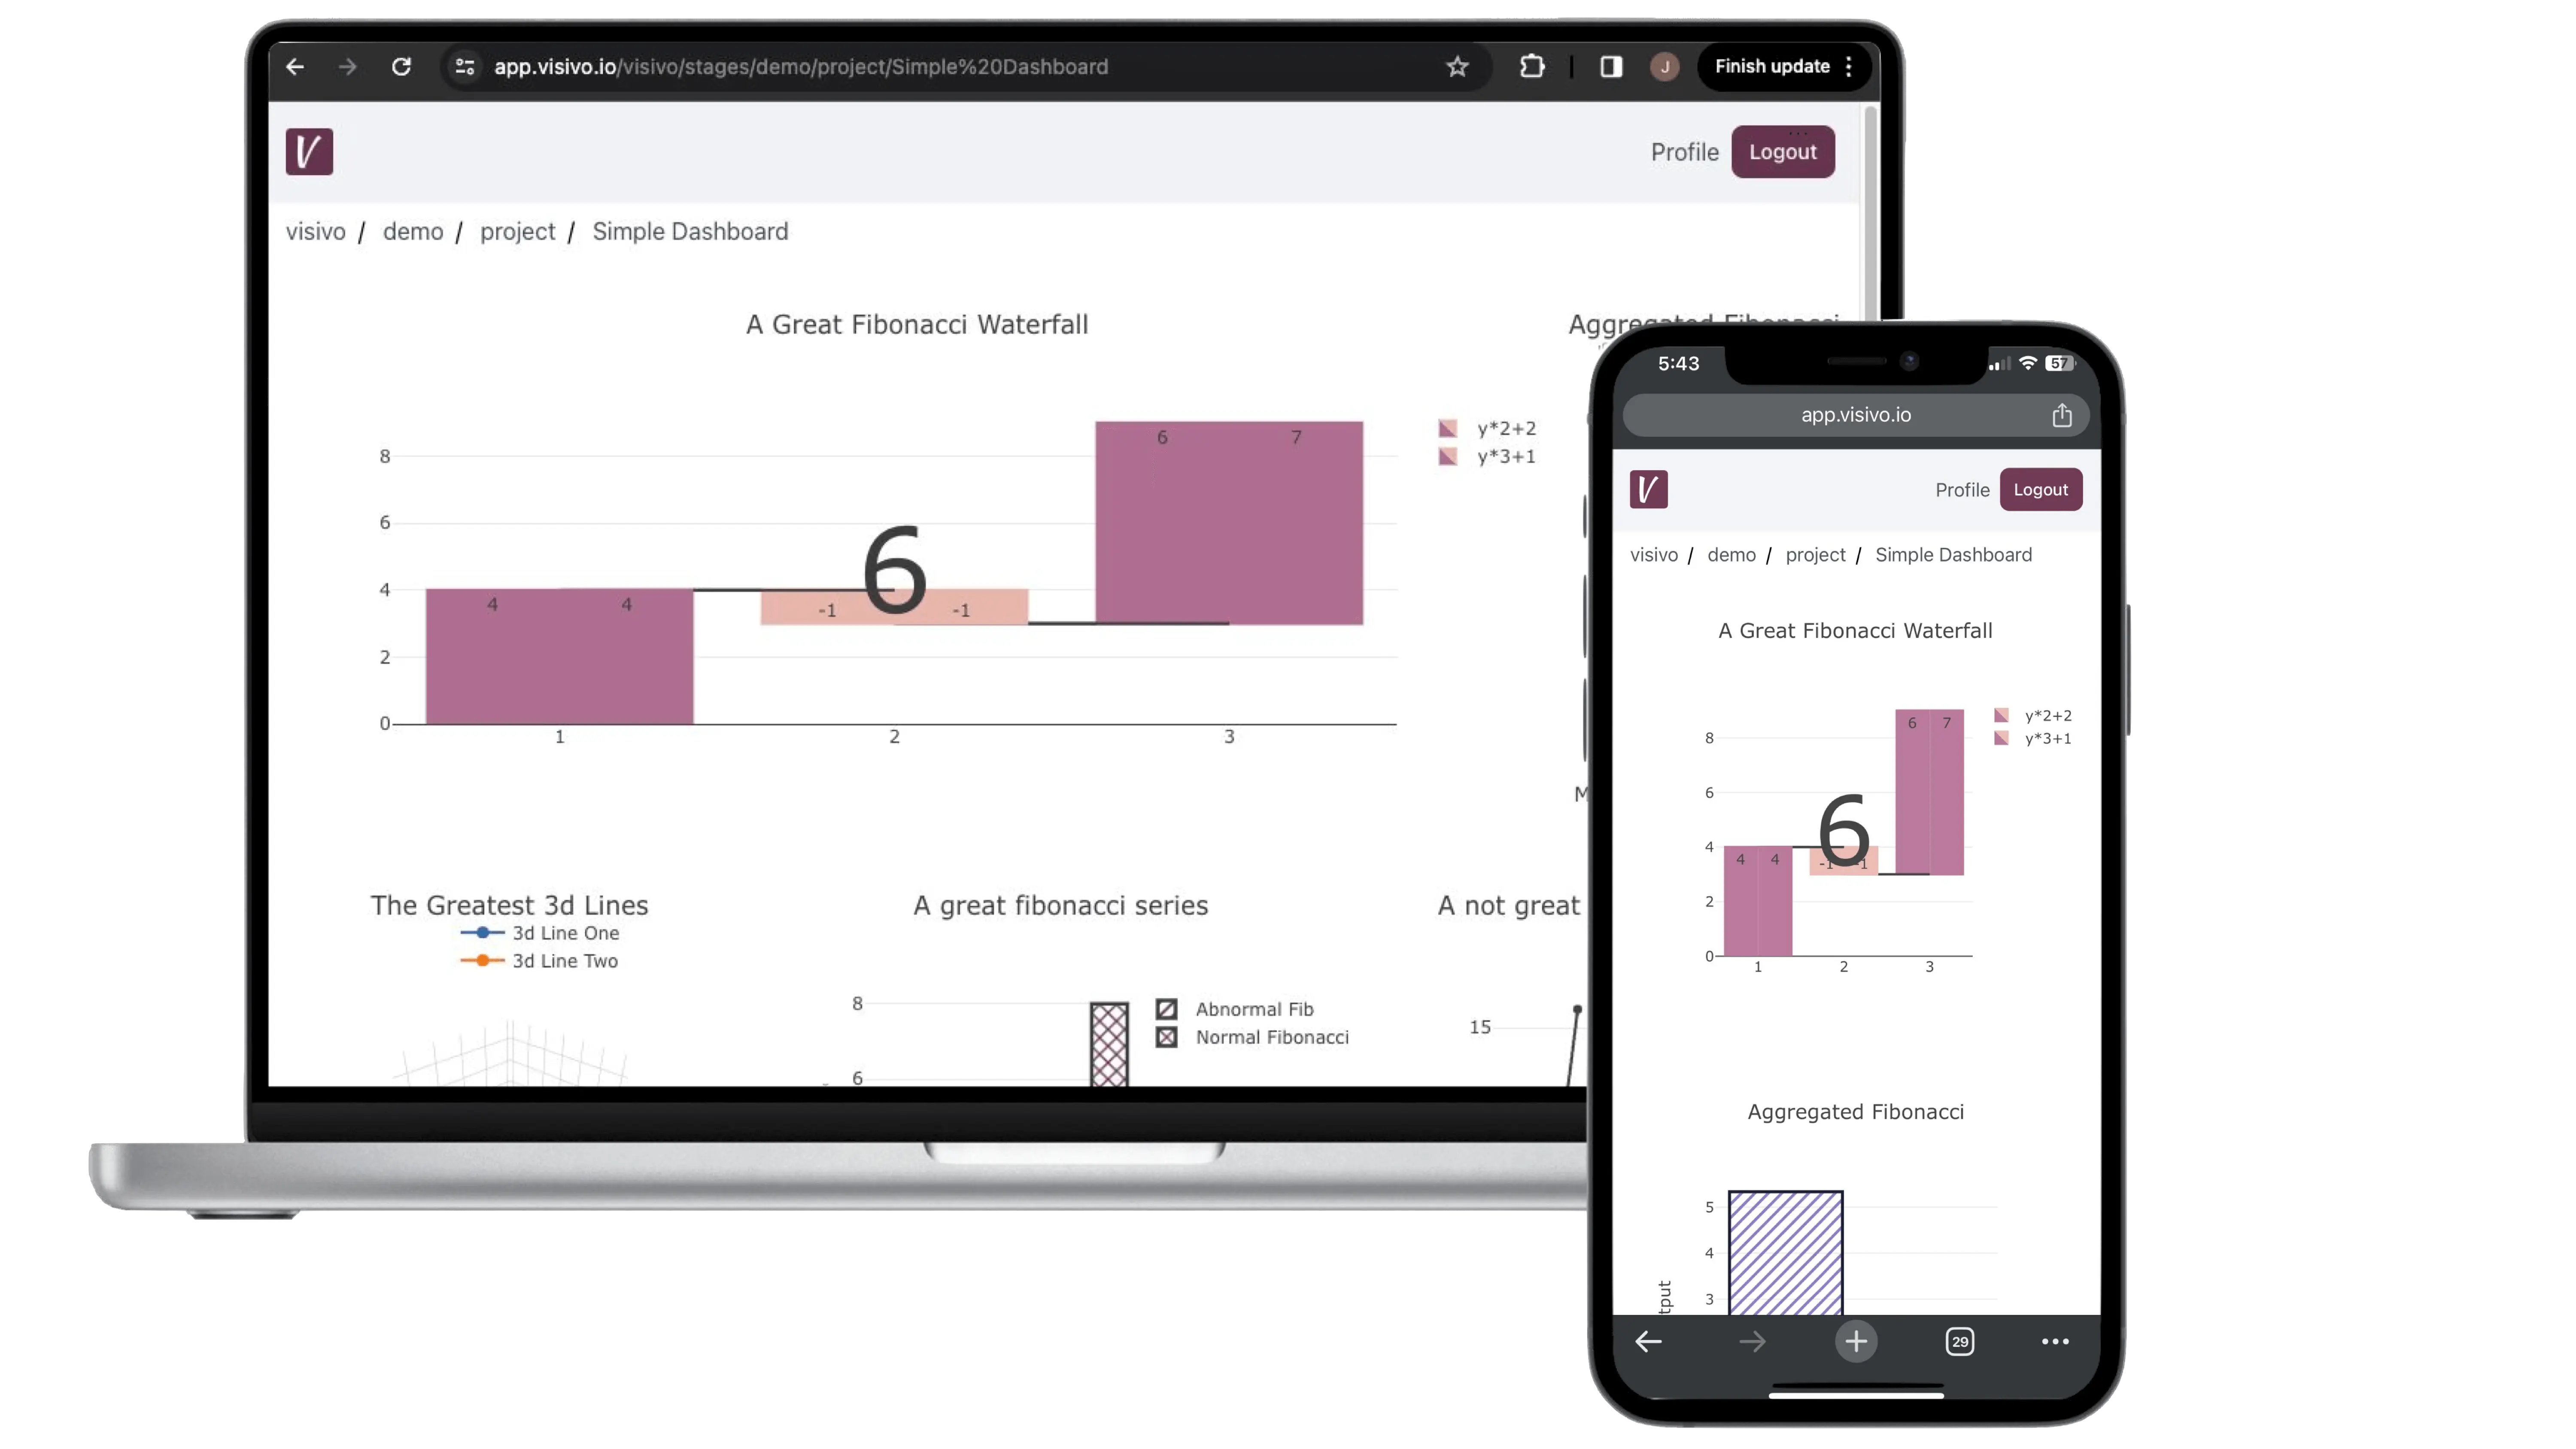


Mobile Optimized
Meet your stakeholders where they are
Deliver your insights to your team on the go and in the office.
Start improving your workflow today
Install our CLI for local development, then activate your trial for deployments. No credit card required.
$ curl -fsSL https://visivo.sh | bash


