
CEO & Co-founder of Visivo
BI That Integrates with dbt Workflows for Seamless Analytics
Discover how integrating BI tools with dbt workflows creates seamless analytics pipelines with consistent metrics and automated updates.
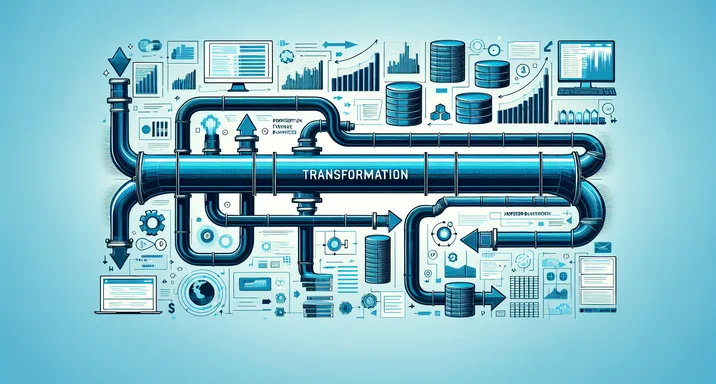
dbt™ brought software engineering practices to SQL transformation. According to the dbt State of Analytics Engineering, 85% of data teams now use dbt™ for transformations. Far fewer have a clean path from the tables dbt™ builds to the charts people look at. The BI tool usually re-derives the logic in its own metadata store, and from that point the two drift. When the BI tool reads dbt™ output directly, metrics stay consistent, a change in a model propagates to every chart built on it, and transformation and visualization run as one pipeline.
What dbt™ does
dbt™ (data build tool) is the standard tool for transformation in the modern data stack. According to a widely-cited CrowdFlower survey, data scientists spend about 80% of their time on data preparation and cleaning. dbt™ standardizes that work. Teams transform raw data into analytics-ready tables with SQL, and get version control, testing and documentation that traditional ETL tools never offered. The reference lives at docs.getdbt.com.
A dbt™ model is a SELECT statement that runs inside your warehouse. Instead of extracting data, transforming it elsewhere and loading it back (ETL), dbt™ transforms where the data already is (ELT), on the warehouse's own compute. A finance mart looks like this:
-- models/marts/finance/monthly_revenue.sql
\{\{
  config(
    materialized='table',
    tags=['finance', 'monthly']
  )
\}\}

WITH monthly_orders AS (
  SELECT
    DATE_TRUNC('month', order_date) AS month,
    SUM(order_amount) AS gross_revenue,
    SUM(discount_amount) AS discounts,
    COUNT(DISTINCT customer_id) AS unique_customers
  FROM {{ ref('stg_orders') }}
  WHERE order_status = 'completed'
  GROUP BY 1
)

SELECT
  month,
  gross_revenue,
  discounts,
  gross_revenue - discounts AS net_revenue,
  unique_customers,
  (gross_revenue - discounts) / NULLIF(unique_customers, 0) AS revenue_per_customer
FROM monthly_orders
dbt™ puts structure, tests and documentation around SQL that used to be scattered across tools, which gives the business logic one versioned home. According to McKinsey Global Institute, data-driven organizations are 23x more likely to acquire customers, and consistent metrics are what make an organization data-driven in practice rather than on a slide. For how dbt™ fits a BI-as-code workflow end to end, see dbt™ BI-as-code integration.
Why connect BI to dbt™
The usual setup is two systems that occasionally sync. dbt™ builds the tables, and the BI tool copies the logic into its own store, where it is edited through menus and never diffed. Connecting them properly means a change flows from transformation to visualization with nothing re-typed in between.
Consistent metric definitions. The hardest problem in analytics is getting everyone to use the same definitions. When finance calculates revenue one way and sales calculates it another, trust erodes. Visivo reads your dbt™ models directly. Each dbt™ model becomes a Visivo model with the same name, so an Insight charts the dbt™ output instead of a copy of its logic:
# project.visivo.yml (excerpt)
dbt:
  enabled: true

insights:
  - name: monthly-net-revenue
    props:
      type: bar
      x: ?{ ${ref(monthly_revenue).month} }
      y: ?{ sum(${ref(monthly_revenue).net_revenue}) }
The net_revenue calculation lives in one place, the dbt™ model. Every Insight that references it uses the same number.
Lineage and impact analysis. Visivo computes a lineage graph during compile, from sources through models and Insights to dashboards, and shows it in the Explorer when you run visivo serve. Because dbt™ models enter that graph as Visivo models, you can see which charts and dashboards depend on a dbt™ model before you change it.
How the integration works
Visivo's dbt™ integration uses the artifacts dbt™ already produces. When the dbt: block is enabled, Visivo reads three files:
dbt_project.yml, to find the profile and the target path.profiles.yml, where each target becomes a Visivo source named<profile>_<target>.target/manifest.json, where each dbt™ model becomes a Visivo model that selects from the table dbt™ built.
# project.visivo.yml (excerpt)
dbt:
  enabled: true
  dbt_project_yml_location: dbt
  profiles_yml_location: dbt
  output_file: includes/dbt.yml
Visivo refreshes the generated models and sources each time it compiles the project. You can also refresh them on their own with visivo dbt. If the manifest does not exist yet, run dbt compile first. Set output_file to a path inside your project to commit the generated models and sources to Git, and set prefix if a dbt™ model name conflicts with a model you already have.
One deployment pipeline. Build the dbt™ models first, then run, test and deploy the Visivo project to Visivo Cloud from the same job:
# .github/workflows/analytics.yml
name: Analytics Pipeline

on:
  push:
    branches: [main]

jobs:
  build_and_deploy:
    runs-on: ubuntu-latest
    steps:
      - uses: actions/checkout@v4

      - uses: actions/setup-python@v5
        with:
          python-version: "3.12"

      - name: Install dbt and Visivo
        run: pip install dbt-postgres visivo

      - name: Run dbt
        run: |
          dbt deps
          dbt build

      - name: Run and test Visivo
        run: |
          visivo run
          visivo test

      - name: Deploy dashboards
        run: visivo deploy -s production
        env:
          VISIVO_TOKEN: ${{ secrets.VISIVO_TOKEN }}
Running dbt™ and Visivo as one pipeline
Once dbt™ and Visivo run in the same pipeline, four things get easier.
Targeted change propagation. When a dbt™ model changes, you do not have to rerun the whole project. The --dag-filter flag runs one object and everything downstream of it:
# Rebuild the changed dbt model, then rerun only the Visivo objects that depend on it
dbt build --select monthly_revenue
visivo run --dag-filter 'monthly_revenue+'
One testing story. dbt™ tests check the tables. Visivo tests check the values your Insights compute from those tables:
# dbt schema.yml
models:
  - name: dim_customer
    columns:
      - name: customer_id
        tests:
          - unique
          - not_null
# project.visivo.yml (excerpt)
tests:
  - name: monthly-revenue-is-positive
    assertions:
      - ">{ numpy.min( ${ref(monthly-net-revenue).props.y} ) > 0 }"
dbt build runs the first set and visivo test runs the second, so a bad transformation and a bad chart both fail the pipeline before anything deploys.
One development loop. A new metric starts as a dbt™ model and ends up in a chart without leaving the terminal:
# Developer workflow
# 1. Create new metric in dbt
echo "
SELECT
  customer_id,
  COUNT(*) as order_count,
  AVG(order_value) as avg_order_value
FROM {{ ref('fct_orders') }}
GROUP BY customer_id
" > models/marts/customers/customer_order_summary.sql

# 2. Test the model
dbt run --models customer_order_summary
dbt test --models customer_order_summary

# 3. Available in Visivo
visivo serve
# Visivo reads the new manifest and adds customer_order_summary as a model
# Reference it from an Insight with ${ref(customer_order_summary)}

# 4. Deploy together
git add .
git commit -m "Add customer order summary metric"
git push  # Triggers integrated deployment
Alerts when tests fail. Find out that the numbers broke before a stakeholder does. A Visivo alert fires after a visivo test run and sends the result to Slack, email or the console:
# project.visivo.yml (excerpt)
alerts:
  - name: revenue-tests-failed
    if: ">{ anyTestFailed() }"
    destinations:
      - name: data-team-slack
        type: slack
        webhook_url: ${env.SLACK_WEBHOOK}
For freshness of the tables themselves, use dbt source freshness in the same pipeline.
Organizations with integrated dbt™ and BI workflows report:
- Zero metric discrepancies between reports
- Significantly faster dashboard development
- Dramatic reduction in "why are these numbers different?" investigations
- 100% traceable data lineage from source to dashboard
When dbt™ owns transformation and the BI layer reads its output instead of re-deriving it, the number on the dashboard is the number in the warehouse. There is nothing to reconcile, because there is only one definition.
If you already run dbt™, the dbt: block is the shortest path from your marts to a chart. /get-started covers the install, and the full reference for the block lives in the Visivo documentation.