One source of truth
Define each metric once. The same number shows up everywhere.
Semantic layer · liveNumbers don't match between tools, dashboards break, and every change waits on the data team. Visivo brings the reliability software engineers take for granted to everyone who depends on data: one source of truth the whole company can build on.
Visivo fixes the three things that quietly erode trust in every dashboard.
Define each metric once. The same number shows up everywhere.
Semantic layer · liveFilter, slice and sort the moment a question lands. No ticket. No backlog.
Insights + interactivity · liveEvery change is reviewed, versioned, reversible. See what breaks before you ship.
BI-as-code + lineage · liveEvery object in Visivo has its place in one connected flow, the same colors you'll see inside the product's lineage and explorer.
Build in the visual UI, let a coding agent edit the project, or write the YAML by hand. Every surface acts on the same version-controlled project and semantic layer. Choose the surface per task, not per person.
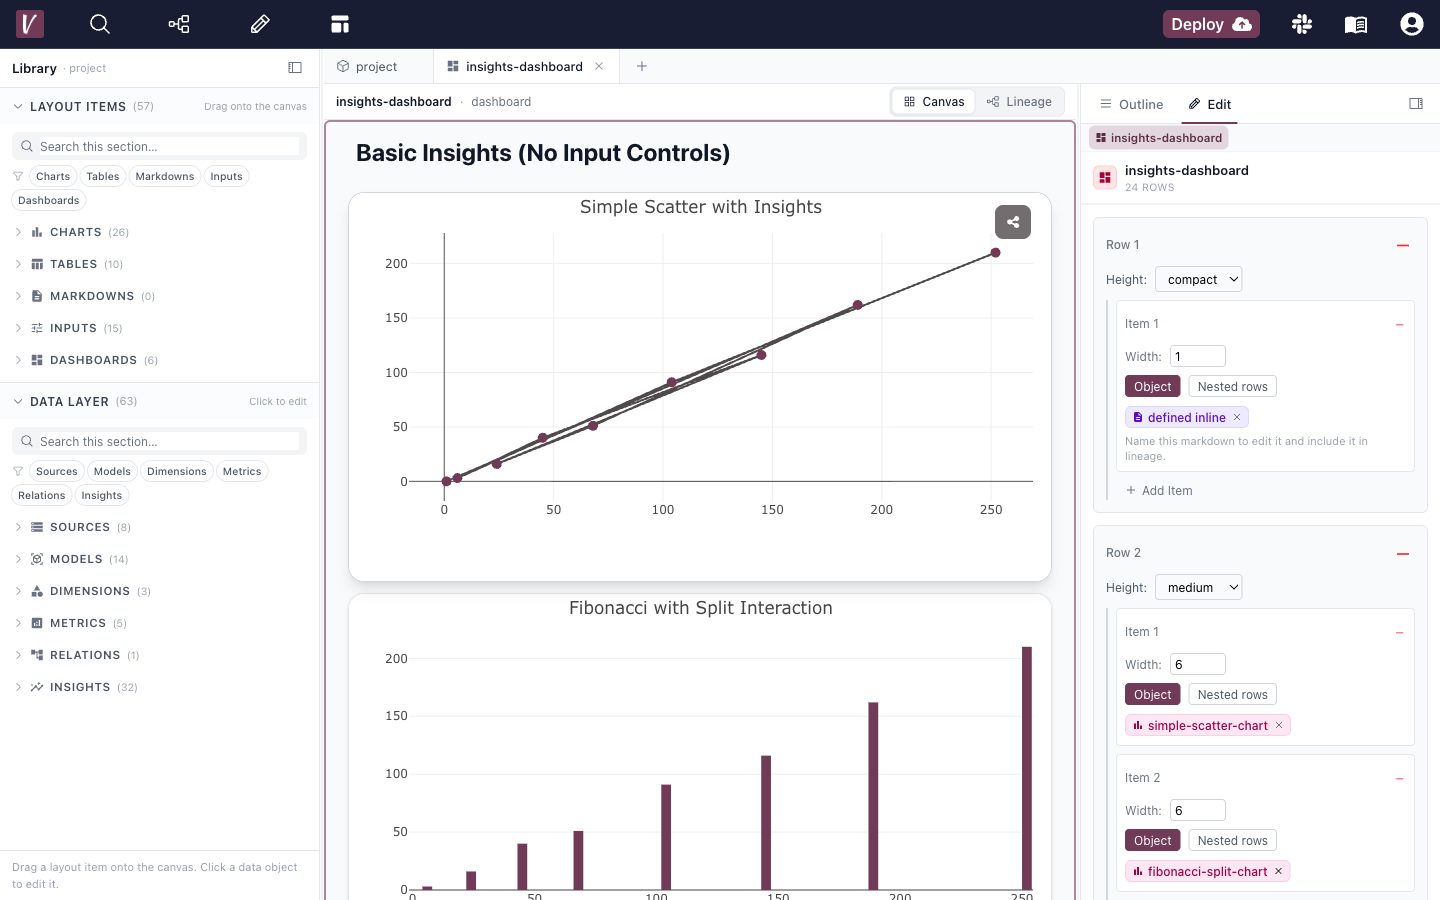
You drag tiles onto a live canvas, and Visivo writes the layout into the same project.visivo.yml.
metric net_revenue: …chart mrr_by_month: …dashboard Revenue: …One semantic layer · one Git history · type-checked against a JSON schema
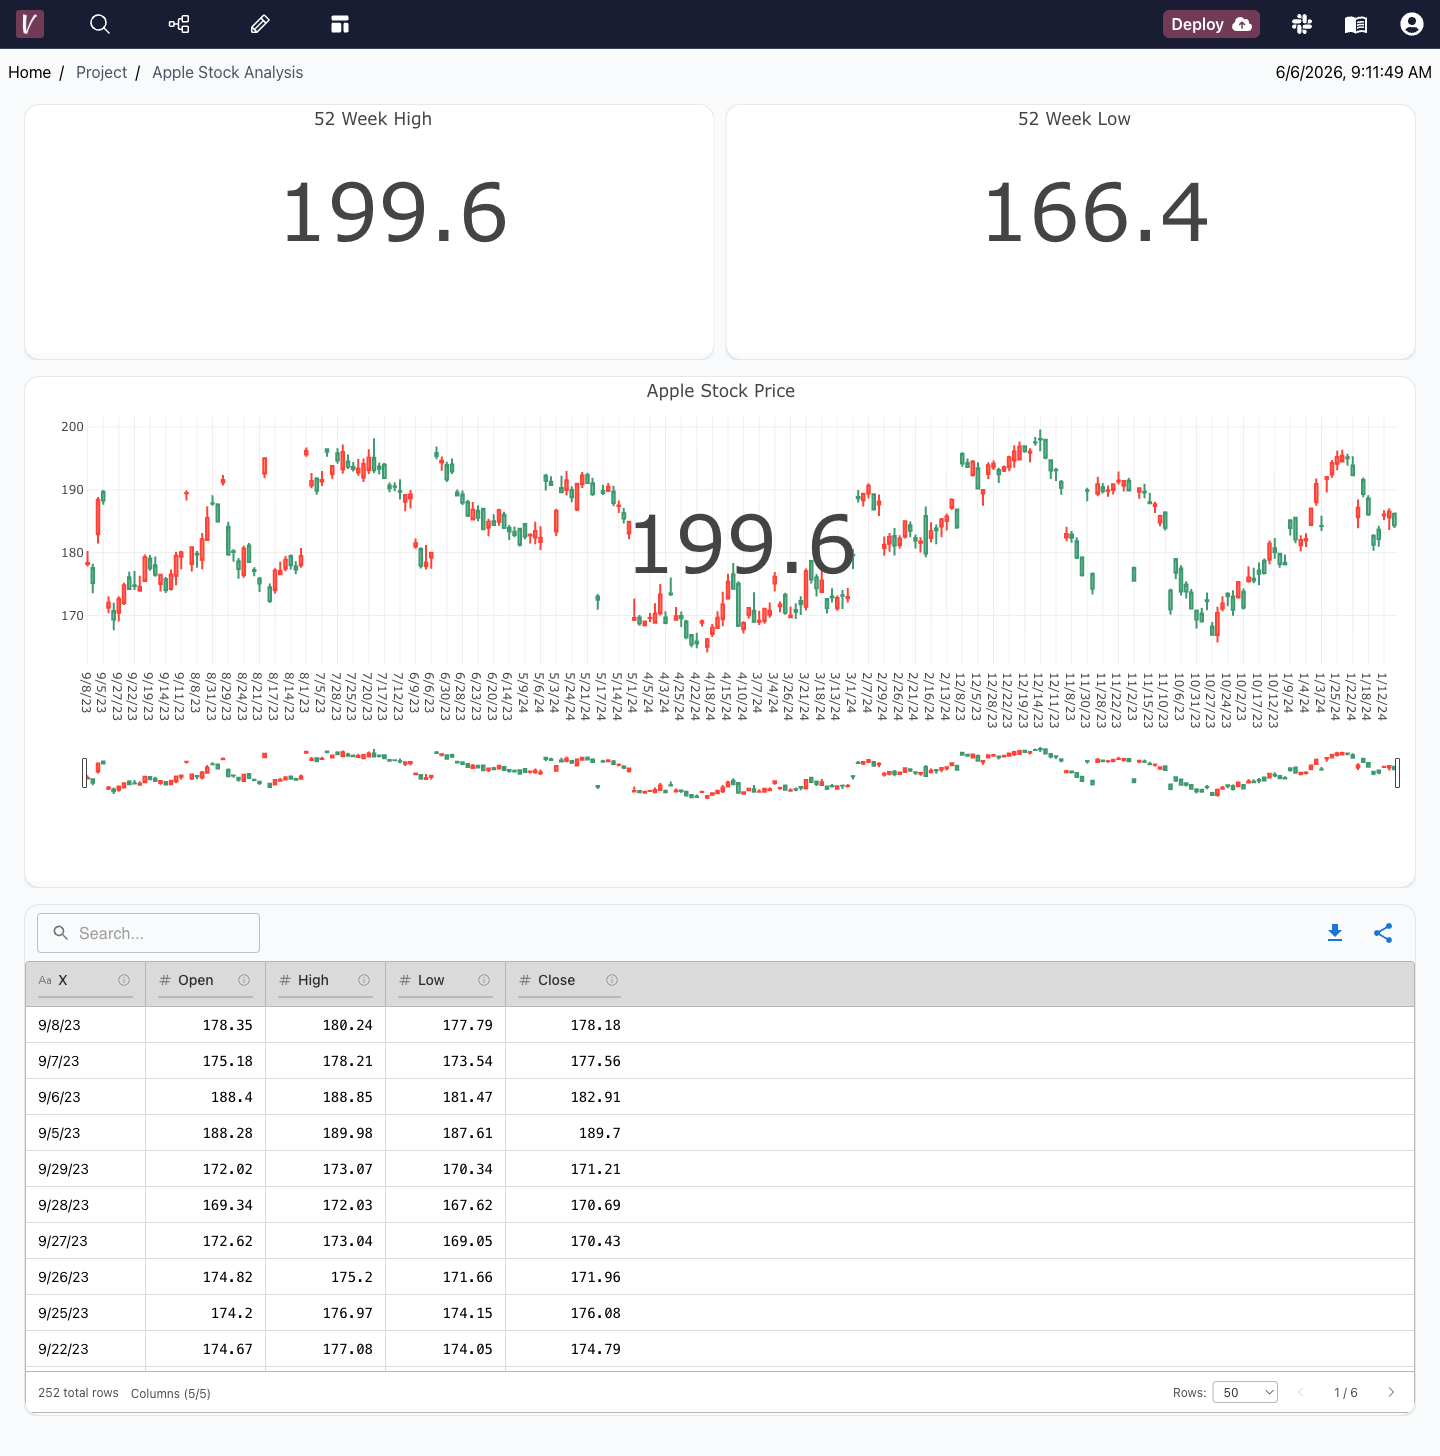
KPI tiles, rich charts, and live data tables, with every number tied to a metric defined once.
Compose dashboards on a drag-and-drop canvas with a recursive row / item layout, then flip the same dashboard to its lineage DAG to see what depends on what.
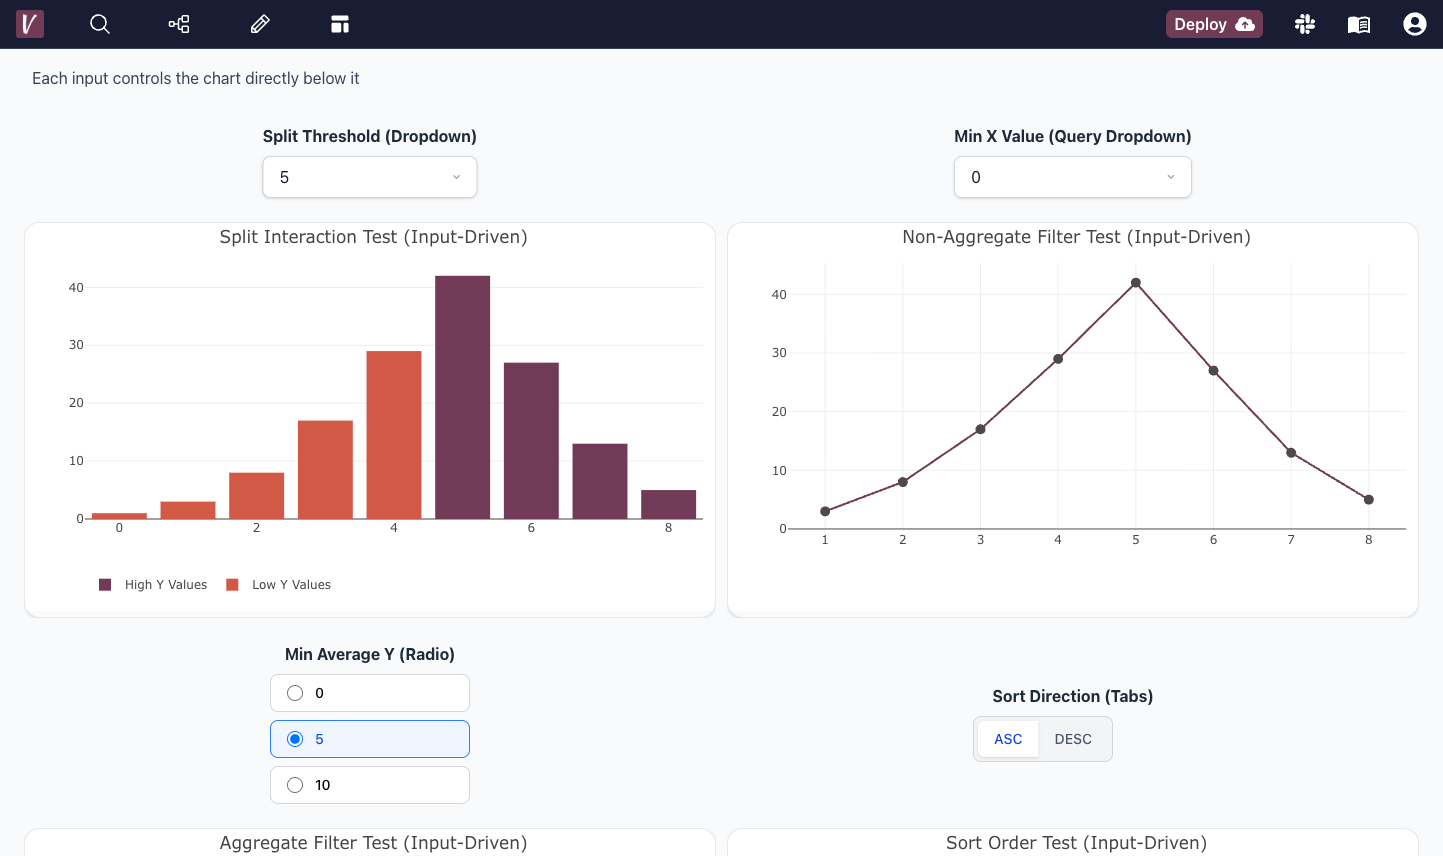
Insights aggregate once, then filter, split, and sort instantly. Dropdowns, sliders, radios, checkboxes and chips put exploration in everyone’s hands.
“The ease of developing and maintaining dashboards has resulted in our team quickly building a much higher degree of visibility into our data. It's a huge improvement in security over giving a tool unfettered access to databases.”
 Dan Manges
“Visivo made it easy for us to deliver fast, reliable dashboards that our stakeholders can trust. Having a single source of truth, with full version control, has completely transformed the way our team builds and shares insights.”
 Clara Davison
Start free in the cloud, or install the CLI and spin up a local dashboard with hot-reload before you touch anything.