BI-as-Code for Modern Data Teams
Build, test, and deploy analytics dashboards using software engineering best practices. Integrates seamlessly with your dbt™ workflows for a unified analytics stack.
Enterprise-Grade Analytics Development
Bring software engineering rigor to your business intelligence workflows.
Version Control
Track every change to your dashboards. Review changes through pull requests. Roll back when needed.
CI/CD Pipeline
Automated testing, validation, and deployment. Deploy to production with confidence.
Infrastructure as Code
Define dashboards, data sources, and permissions in YAML. Reproducible environments.
Branching Workflows
Create feature branches for new dashboards. Test in isolation before merging.
Automated Testing
Test your queries, calculations, and data quality automatically on every commit.
Modular Design
Reusable components, templates, and shared queries across all dashboards.
Faster Feedback Cycles, Better Analytics
Stop waiting days for dashboard changes. With Visivo, iterate on analytics as fast as you iterate on code.
Instant Local Preview
See changes immediately with `visivo serve`. No waiting for deployments or data refreshes.
Hot Reload Everything
Edit YAML, save, see results. Charts update live as you modify queries and configurations.
Test Before Deploy
Validate data quality and dashboard accuracy locally before pushing to production.
Seamlessly Manage Multiple Environments
From local development to production, maintain consistency across all your environments.
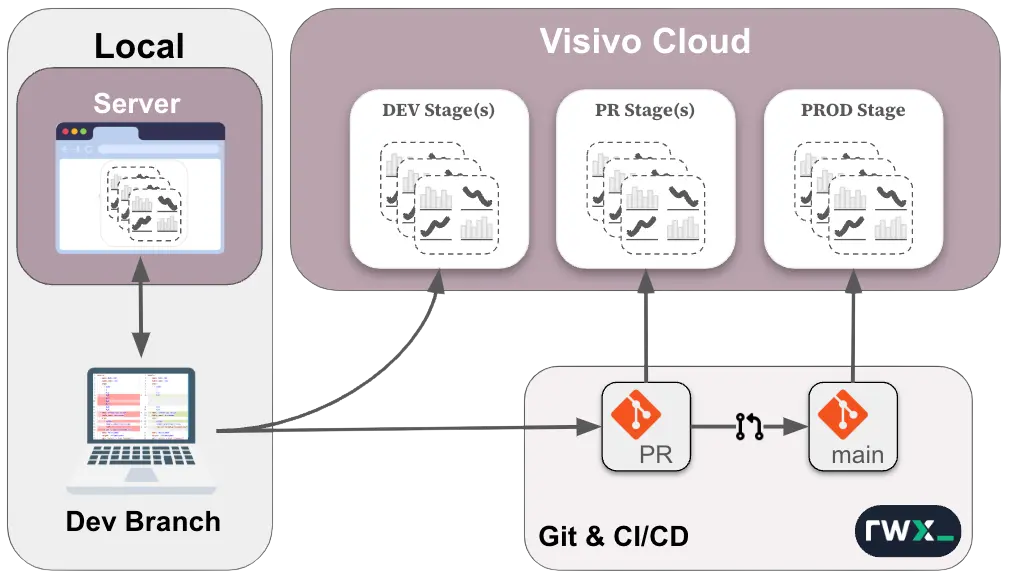
Works with Your Existing Workflow
- Branch-based development for isolated changes
- Automatic staging deployments for every PR
- Production deployments on merge to main
Integrates with dbt™
- Reference dbt™ models directly in your dashboards
- Leverage existing transformations and tests
- Maintain single source of truth for metrics
Everything as Code
Define Dashboards in YAML
python# project.visivo.yml
name: Sales Analytics
# Define your business logic once in the semantic layer
models:
- name: monthly_metrics
sql: SELECT * FROM ${ref(monthly_metrics)}
metrics:
- name: total_revenue
expression: "SUM(revenue)"
description: "Total revenue across orders"
dimensions:
- name: order_month
expression: "DATE_TRUNC('month', order_date)"
# Insights turn that logic into interactive charts
insights:
- name: revenue-kpi
model: ${ref(monthly_metrics)}
props:
type: indicator
mode: number+delta
value: ?{ ${ref(monthly_metrics).total_revenue} }
interactions:
- filter: ?{ ${ref(monthly_metrics).order_month} = date_trunc('month', current_date) }
charts:
- name: revenue-kpi-chart
insights:
- ${ref(revenue-kpi)}
dashboards:
- name: Sales Overview
rows:
- height: small
items:
- chart: ${ref(revenue-kpi-chart)}Automated Deployment
python# .github/workflows/visivo.yml
name: Test & Deploy Dashboards
on:
push:
branches: [main]
jobs:
test:
runs-on: ubuntu-latest
steps:
- uses: actions/checkout@v3
- name: Install Visivo
run: curl -fsSL https://visivo.sh | bash
- name: Test dashboards
run: visivo test
- name: Deploy to staging
run: visivo deploy -s staging
env:
VISIVO_TOKEN: ${{ secrets.VISIVO_TOKEN }}Why BI-as-Code?
For Analytics Teams
No more broken dashboards after data model changes
Collaborate effectively with pull requests and code reviews
Test dashboards before they reach stakeholders
Reuse components across multiple dashboards
For Business Users
Reliable dashboards that update automatically
Consistent design and user experience
Fast performance with optimized queries
Clear documentation and data lineage
Ready to Transform Your BI Workflow?
Join teams building reliable, version-controlled analytics with BI-as-Code.
$ curl -fsSL https://visivo.sh | bash